Select signals to display
Select any combination of signals from one or multiple detectors to view in the Online Signals window. The signals available are determined by your selections in the Method layout.
This window determines which plots are to be displayed and saved during a run.
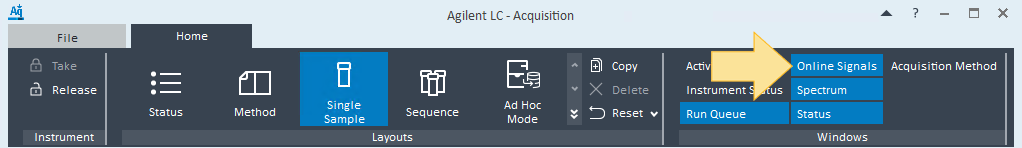
Open the Online Signals window.
Click
 to expand the signal pane.
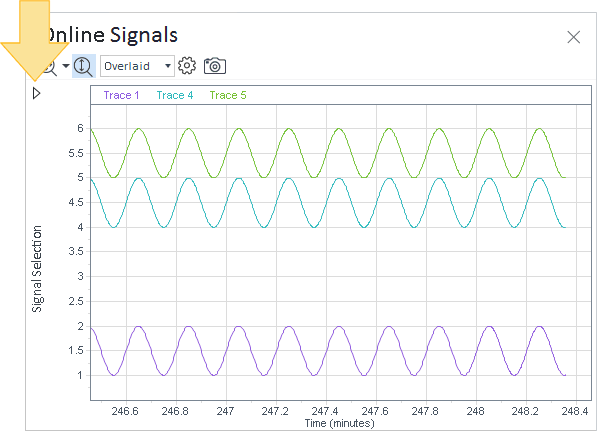
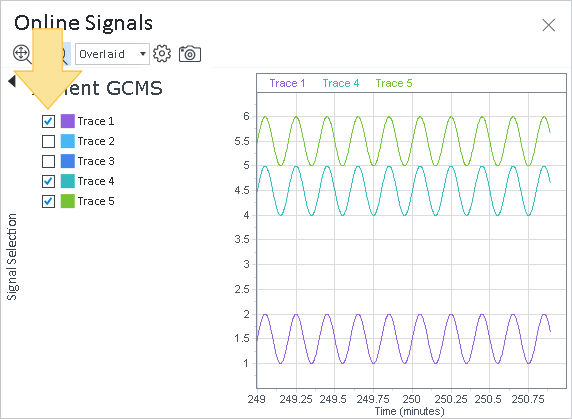
Select the signals in the left panel to display in the real-time plot. Signals are grouped by detector. Signals displayed here are determined in the Method layout.
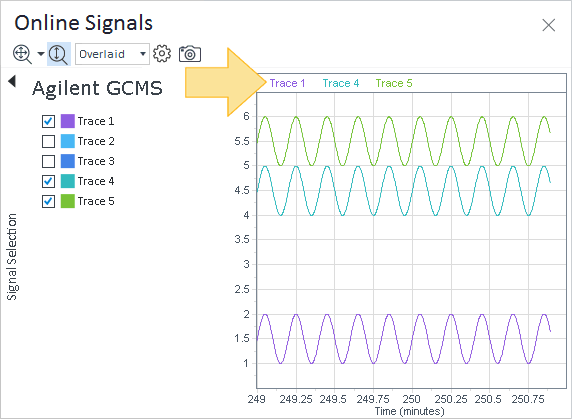
Click the individual legend for each signal to view the corresponding y-axis unit.
When a new injection starts, a red vertical line appears in the real-time plot, the x-axis of the start marker becomes 0, and the scale to the left of the start marker displays negative values.
base-id: 12676035979
id: 12676035979