Set the Online Signals refresh option
You can choose to have the Online Signals chart display a continuous flow of data or refresh each time a new sample is injected.
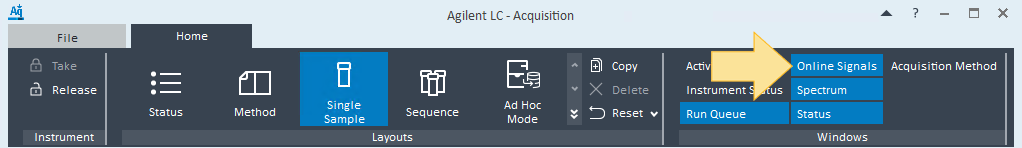
Open the Online Signals window.
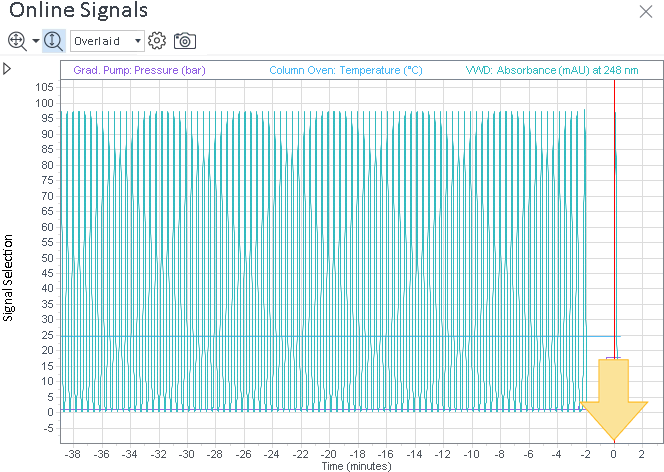
Click the Autoscale all panes arrow.
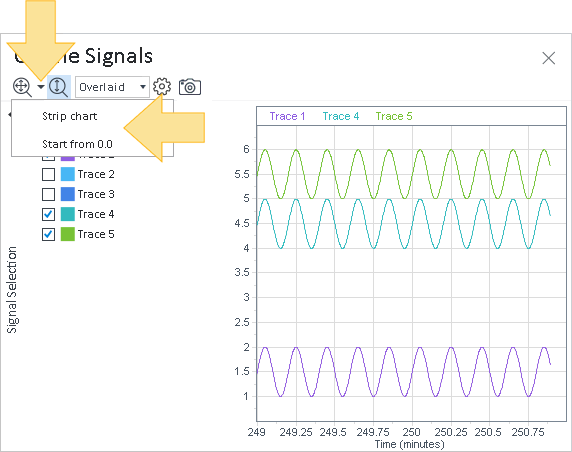
Select:
Strip chart to display the continuous online signal data stream from right to left. When a new sample is injected, the x-axis resets to 0.0.
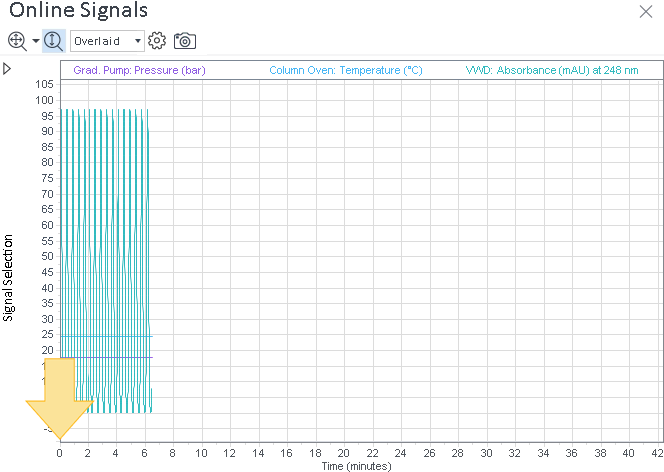
Start from 0.0 to only display the online signal data from the current sample. When a new sample is injected, signal data from the previous sample is cleared and the online signal data for the current sample is displayed starting at the origin of the graph.
base-id: 12676041867
id: 12676041867