Scaling options referring to peaks
Scaling to n-th largest peak
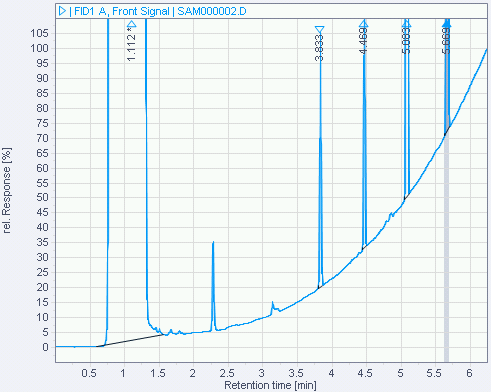
If you scale to 100 % of the largest peak, the system evaluates all integrated peaks and uses the largest peak as a scale for the diagram. The solvent peak is not integrated and therefore not recognized as a peak.
The following example shows a GC chromatogram with a solvent peak, where the solvent peak has not been integrated. The largest peak is the peak at 5.083 min.
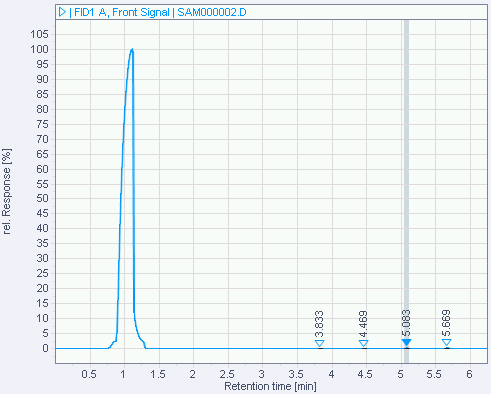
NOTE
With the option Ignore n largest peaks, the system would not ignore the solvent peak, as it is not integrated and therefore not recognized as a peak. In this example, scaling to the first integrated peak would be the most suitable option.
Ignore n largest peaks
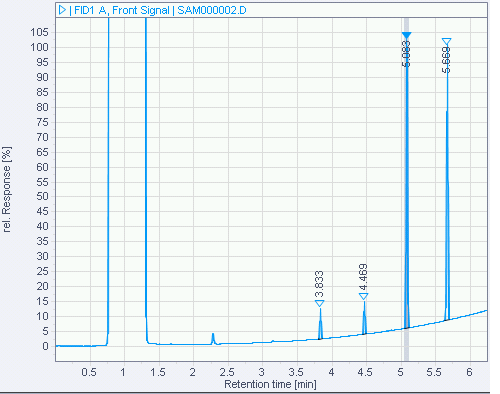
If you ignore the largest peak, the system evaluates all integrated peaks and uses the 2nd largest peak to scale the diagram.
The following example shows a GC chromatogram with a solvent peak, where the solvent peak has been integrated. The largest peak (ignored) would therefore be the solvent peak.
This option can be useful, for example, for GC chromatograms, where the solvent peak is integrated and the sample peaks are located on the shoulder of the solvent peak. It can also be useful if the overall baseline is rising or going down to a great extent.
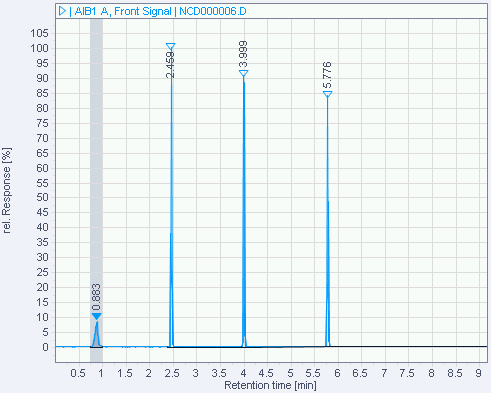
Scale to baseline
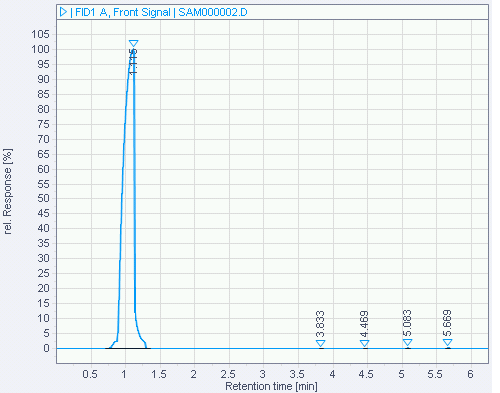
With the Scale to baseline option, the application ignores all identified peaks and scales the chromatogram to what it considers as the baseline. This option can be useful to examine the baseline, or to check if there are any not identified peaks that are not integrated although they should have been.
NOTE
If a solvent peak has not been integrated, the values are treated as part of the baseline.
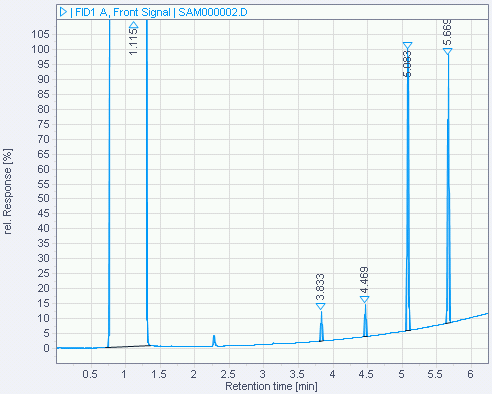
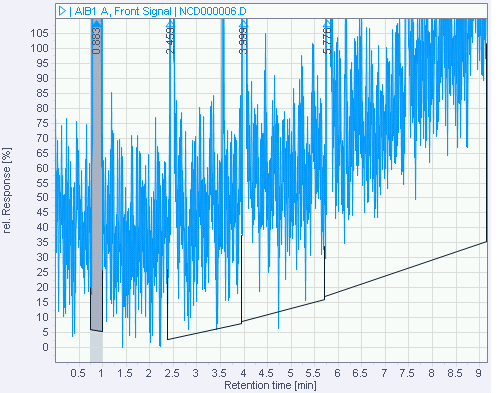
The following examples show a GC chromatogram scaled to baseline. In the first chromatogram, the solvent peak has not been integrated and is treated as part of the baseline. In the second chromatogram, the solvent peak has been integrated, and you can see more details on the baseline.
The following figures show another example of the scale to baseline option.
See Also
base-id: 11015081995
id: 11015081995