Tune clusters of combined peaks
The Integration Optimizer assists you if you have clusters of combined peaks that cannot be separated well. Normal integration may not be able to construct a common straight baseline for this cluster of coeluding peaks. With the Custom Baseline and Peak Cluster functions, you add a straight long-range baseline to a specific section of the chromatogram. Within this section, all peaks are separated by drop lines.
Depending on your data, the Custom Baseline and Peak Cluster functions may produce similar results. In the following example, you could use either function:
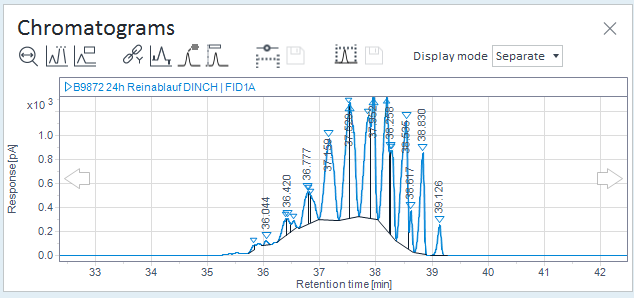
Example: Chromatogram without custom baseline
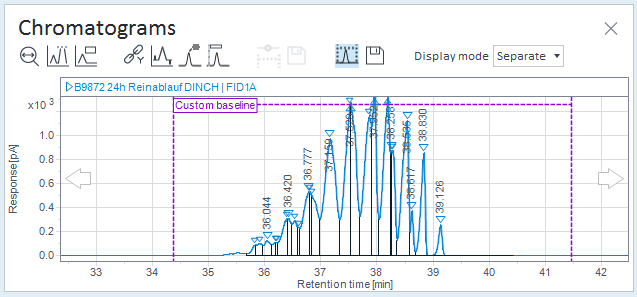
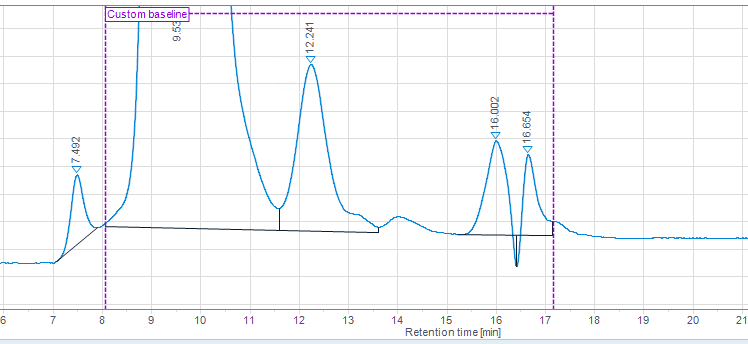
Example: Chromatogram with custom baseline
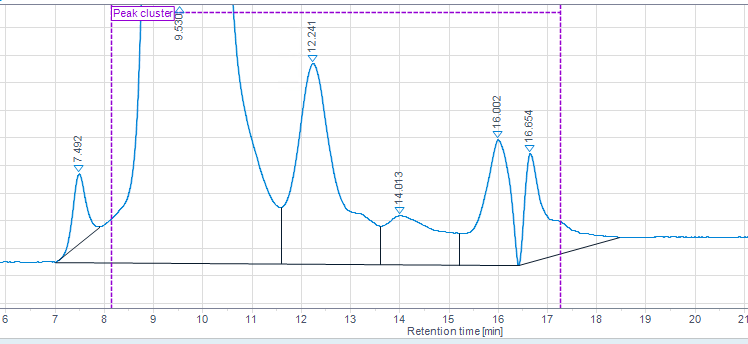
Custom Baseline or Peak Cluster?
The functions return different results, for example, when the range start and end times intersect with peaks, or when there is a slope in the baseline.
For example, see the default intgration:
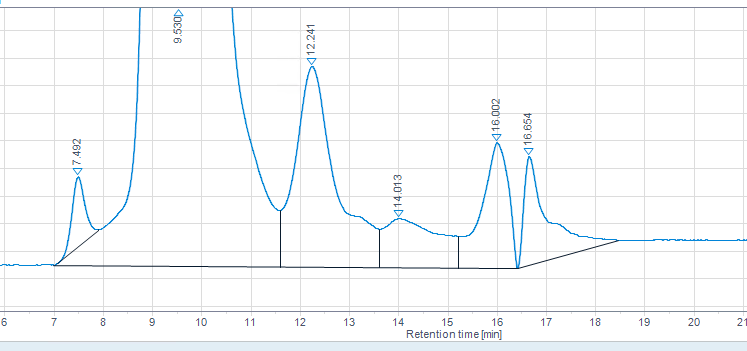
Custom Baseline
The Custom Baseline function
 first reads the start and end
time of the range, and integrates the signal afterwards. The baseline may
penetrate the signal.
first reads the start and end
time of the range, and integrates the signal afterwards. The baseline may
penetrate the signal.This function can be useful for signals where peaks elude reproducibly at the expected retention times.
Peak Cluster
The Peak Cluster function
 uses the existing baseline. The
peak cluster starts with the first peak in the range, and ends with the last
peak in the range. By default, the peak cluster baseline does not penetrate the
signal.
uses the existing baseline. The
peak cluster starts with the first peak in the range, and ends with the last
peak in the range. By default, the peak cluster baseline does not penetrate the
signal.This function can be useful for unstable signals where peaks are not separated well.