Choose the injections shown in the Peak Explorer
By default, the Peak Explorer shows the peaks of all
injections in all loaded result sets. To compare only single injections (even
from different result sets), pin the relevant injections so that they are shown
with a vertical pin
![]() in the injection tree.
in the injection tree.
To show or hide specific signals, select the corresponding check boxes under Signals in the navigation pane.
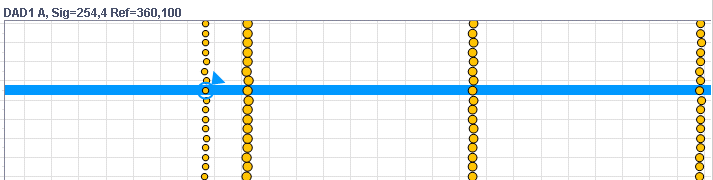
A blue line highlights all bubbles belonging to the focused injection. A blue circle highlights the selected peak of this injection. These selections are synchronized with the injections or peaks selected in other windows.