What is a calibration curve
A calibration curve is a graphical presentation of the amount and response data for one compound obtained from one or more calibration samples.
Normally an aliquot of the calibration sample is injected, a signal is obtained, and the response is determined by calculating the area or height of the peak, similar to the following figure.
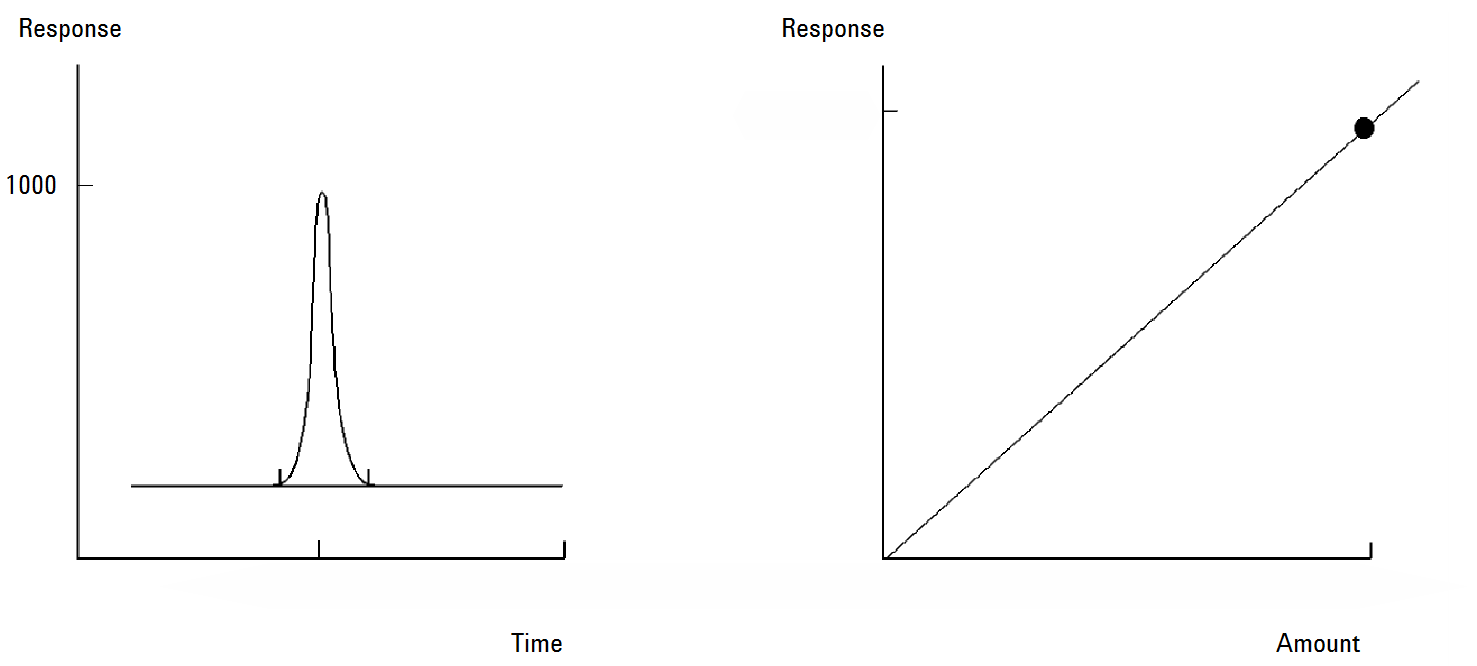
Calibration sample, signal, and calibration curve