Compare graphs from multiple injections
You can compare chromatograms, UV spectra, or MS spectra. The graphs may come from injections within the same sequence, from single samples, or from injections belonging to different sequences. You can even load data from different projects and compare the corresponding graphs.
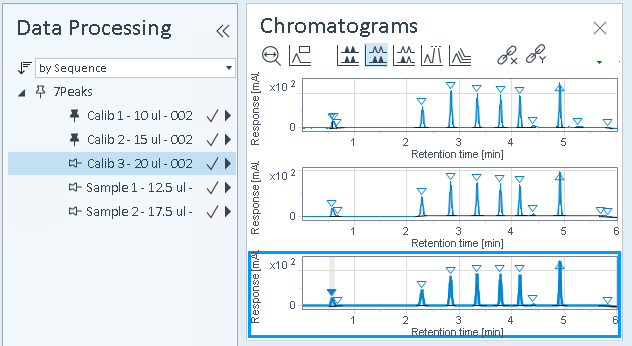
In the injection tree, pin the relevant injections.
If the required window is hidden, click Chromatograms, UV Spectrum, or MS Spectrum in the ribbon to show it.
Highlight another injection for comparison.
In the Chromatograms, UV Spectrum, or MS Spectrum window, select a suitable display option. For example, select Overlaid to compare the chromatograms in one single pane.
Select a suitable scaling option and display mode (see Scaling Options and Display Mode).
Several signals may be displayed. To select or deselect them, see Select signals. In the Chromatograms window, if you choose the display mode Separate, the focused injection is highlighted with a blue border.
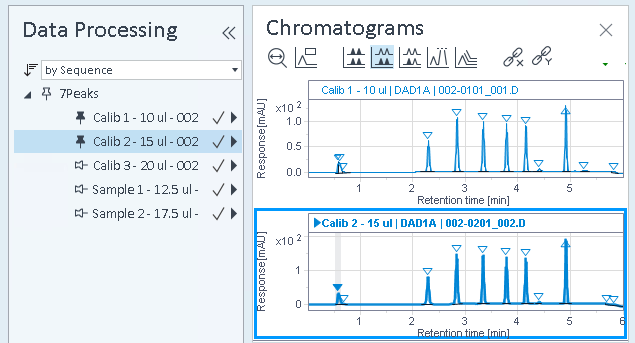
The graph for the focused injection is shown in addition to the graphs for the pinned injections. In the Chromatograms window with separate panels, again, the focused injection is highlighted with a blue border.
The color of the signals is automatically determined by the application.
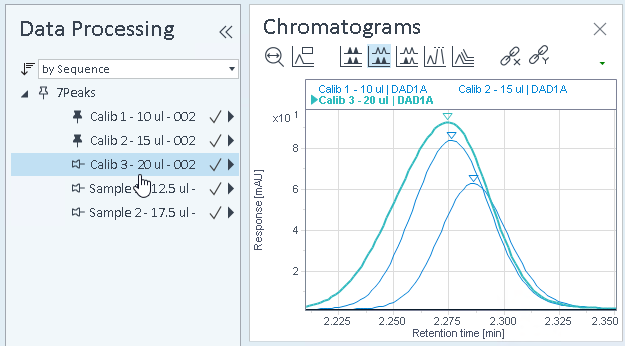
By default, all graphs use the same signal unit scale.