Show the chromatogram of a single injection
In the injection tree, highlight or pin the injection of which you want to review the chromatogram.
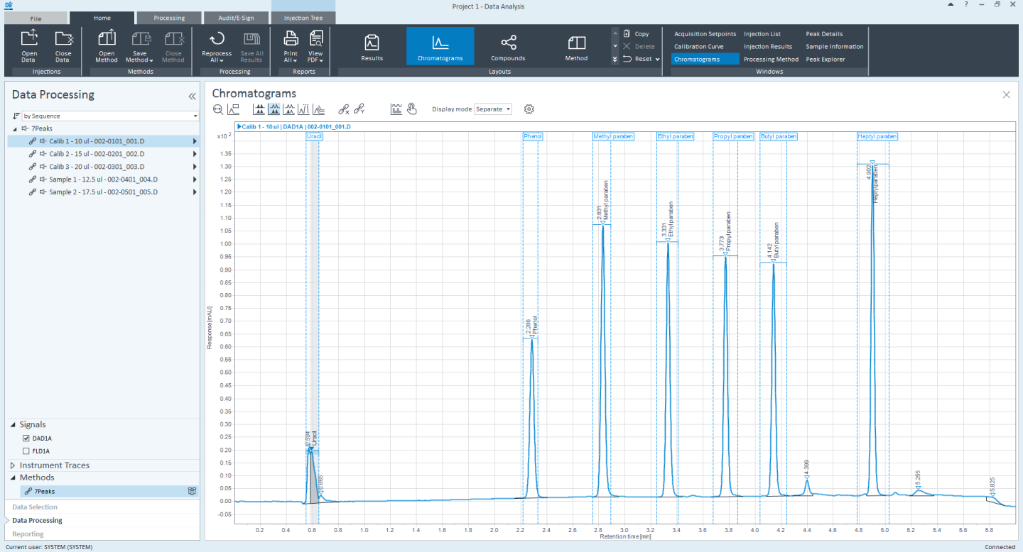
Choose Chromatograms from the Layouts ribbon group.
Select a suitable display mode from the Chromatograms toolbar, for example Overlaid or Separate. For more information on the available display modes, see Scaling Options and Display Mode.
If you want to display only one graph in the window, do one of the following:
In the navigation pane under Signals, clear the check boxes for signals that shall be hidden.
Click the Properties icon
 in the Chromatograms toolbar. On
the Chromatograms page, under
Display options, choose
1 as the number of panels to display. A scrollbar will
then be added to access more
graphs.
in the Chromatograms toolbar. On
the Chromatograms page, under
Display options, choose
1 as the number of panels to display. A scrollbar will
then be added to access more
graphs.
The Data Selection view helps you find and manage the relevant data, methods, or templates.
In case of a multisignal injection, several signals may be displayed. The color of the signals is automatically determined by the application.