Zoom to baseline
To enlarge specifically the baseline region, click
![]() in the toolbar.
in the toolbar.
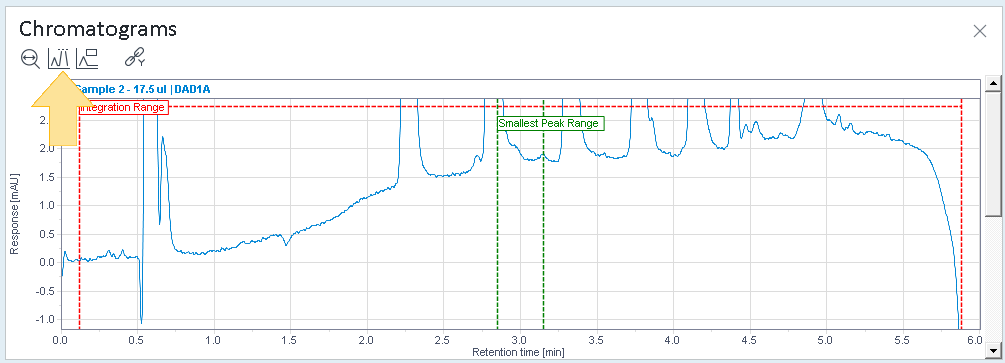
Example chromatogram zoomed to baseline
This allows you to get a closer look at the baseline of all integrated peaks.
What does Zoom to baseline do?
The behavior of this function depends on where you use it:
-
Step 1
The Zoom to baseline function allows you to get a closer look at the base of all the peaks of the chosen signal. If you defined an integration range, only this range is considered.
Click
 to check the peaks near a possible
baseline.
to check the peaks near a possible
baseline.The baseline zoom factor is automatically stored in step 1 in order to be applied in the next steps.
-
Step 2 and 3
In step 2 or 3, click
to show baselines using the previously stored
zoom factor. Use this function to compare baselines in different
injections.The Zoom to baseline function always applies a constant Y-axis delta. If a baseline is shifted, this delta will also be shifted according to your baseline. The X-axis is not affected. If you choose a specific retention time range, this time range will remain unchanged
If the signal is drifting out of sight in
the plot window: Zoom into the relevant time range, irrespective of the
response values where you want to see the signal, then click
![]() . The signal is then shifted into view again,
while maintaining the same response range.
. The signal is then shifted into view again,
while maintaining the same response range.
To zoom out again, click
![]() (Auto
scale chromatograms).
(Auto
scale chromatograms).