Compare signals
The Integration Optimizer allows you to easily compare the integration and baseline construction between different injections. This helps you to check the robustness of the integration parameters.
In step one of the Integration Optimizer, Characterize Chromatogram, focus the relevant signal (for example, DAD1A. Multiple signals are always shown in the Separate display mode, with only one panel visible at a time. To scroll through the signals, use the scrollbar or the [PAGE UP] or [PAGE DOWN] keys. The visible signal automatically becomes the focused signal.
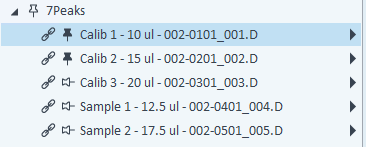
To prepare for comparing different injections, pin the relevant injections.
In step two of the Integration Optimizer, select the display mode Overlaid.
Select a peak.
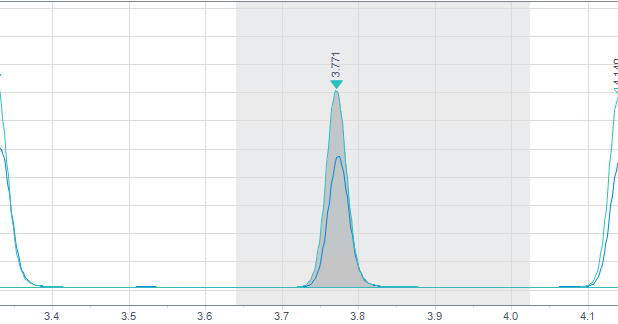
The peak is integrated in both signals. There is a good match, both start times and end times of the peaks are less than 0.005 min away from each other. This good match is indicated by a green color.
-
The peak is integrated in both signals, but the start times and end times of the peaks are 0.005 min or more away from each other. The color corresponds to the signal in which the peak begins first, or ends last respectively. The width of the color box indicates how much the start and end times differ in both signals.
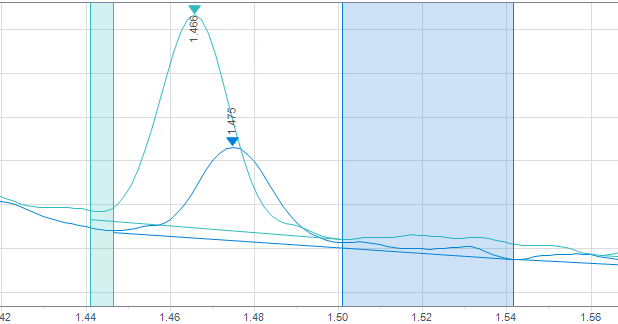
The peak is not integrated in the comparison signal.
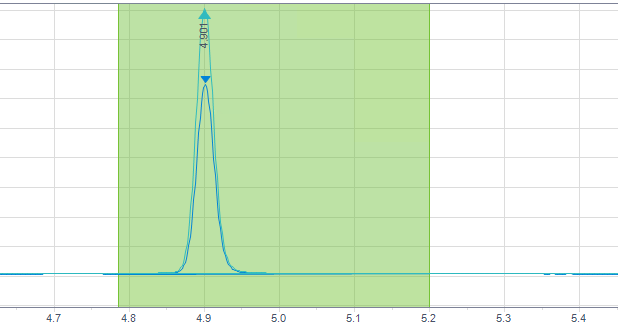
If you did not select any peak before, the signal with the highest peak in the displayed time range is automatically focused.
The color of your focused injection is shown as a small triangle in the chromatogram:
In the Overlaid mode, the peak highlighting shows how well the baselines of the peaks in the pinned signals match: