Allocating the baseline
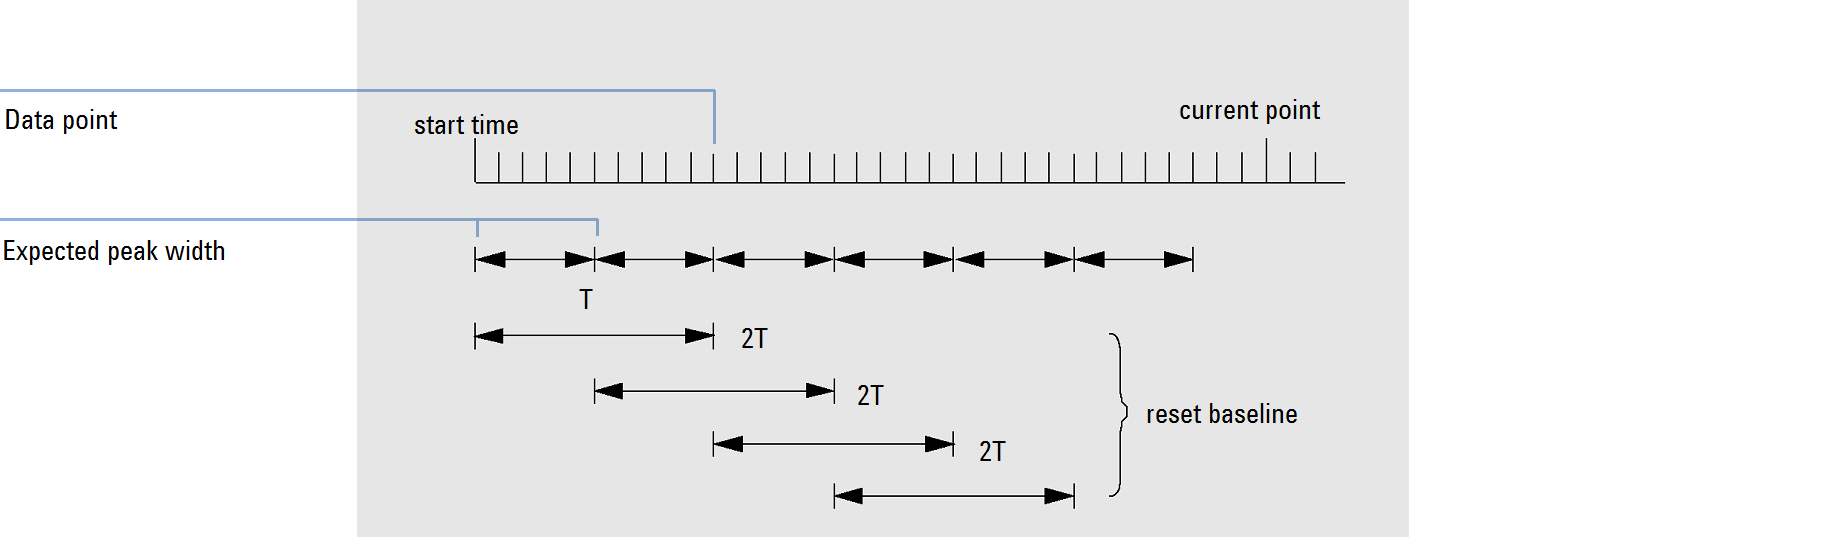
The integrator allocates the chromatographic baseline during the analysis at a frequency determined by the peak width value. When the integrator has sampled a certain number of data points, it resets the baseline from the initial baseline point to the current baseline point. The integrator resumes tracking the baseline over the next set of data points and resets the baseline again. This process continues until the integrator identifies the start of a peak.
Baseline
At the start of the integration process the first data point is used. This baseline point is periodically reset as shown in the figure (see Baseline).
Areas are summed over a time T (expected peak width). This time can never be shorter than one data point. This continues as long as baseline condition exists. Slope and curvature are also taken. If both slope and curvature are less than the threshold, two summed areas are added together, and compared with the previous baseline. If the new value is less than the previous baseline, the new value immediately replaces the old one. If the new value is greater than the previous value, it is stored as a tentative new baseline value and is confirmed if one more value satisfies slope and curvature flatness criteria. This latter limitation is not in effect if negative peaks are allowed. During baseline, a check must also be made to examine fast rising solvents. They may be too fast for upslope detection. (By the time upslope is confirmed, solvent criterion may no longer be valid.) At first time through the first data point is baseline. It is replaced by the 2 T average if signal is on base. Baseline is then reset every T (see Baseline).