Zoom and switch the display mode
The following examples are shown with chromatograms, but are valid for UV spectra as well. Two single runs are shown that have been recorded with the same detector. The graphs are initially shown in separate panes (display mode Separate). When you zoom into the graph and then switch the display mode to Overlaid, the application tries to keep the zooming as far as possible.
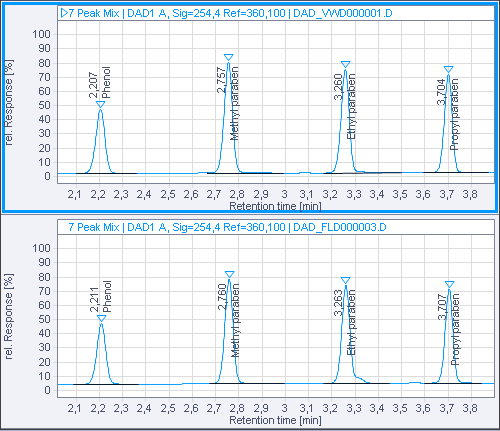
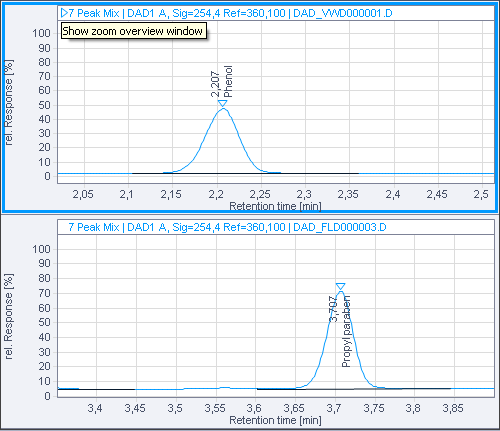
Initially, the graphs are displayed in separate panes without zooming:
Zoom into one peak
As the graphs are shown separately and the axes are not linked, you can zoom in on one of the peaks in the upper graph without changing the display of the lower graph
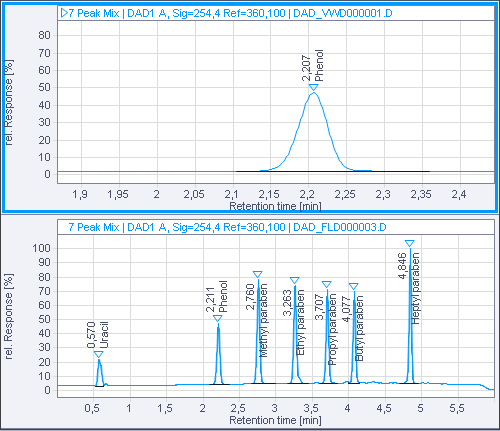
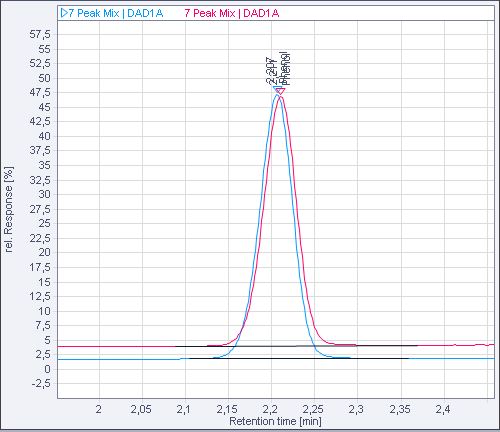
When switching to the Overlaid display mode, the application will keep the zoomed area and only show the single peak in an overlaid graph.
Zoom into different peaks
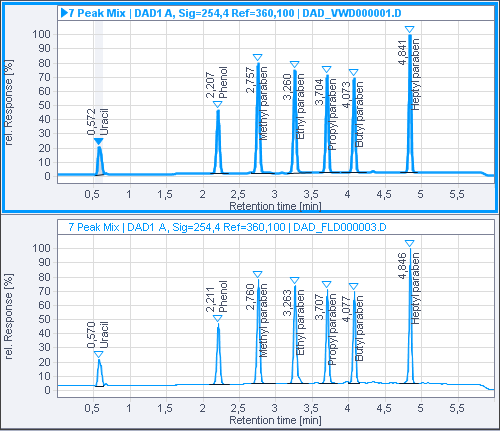
Initially, you can zoom in on different peaks in each of the two graphs.
For example, you zoom in on the second peak at approx. 2.2 min in the upper chromatogram, and in on the fifth peak at approx. 3.7 min in the lower chromatogram.
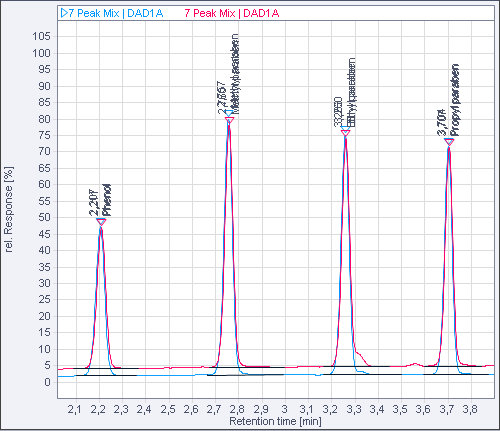
When switching to the Overlaid display mode, the application will find the smallest common zoomed area. In this example, that is the area from the second to the fifth peak.
When switching back to the Separate display mode, the application will keep the previously applied zoomed area.