Zoom and switch injections
In the following example, you can see two runs one after the other. The zooming that you apply to the graph of the first run is kept when you switch to the second run.
All examples are shown with chromatograms, but apply to UV spectra as well.
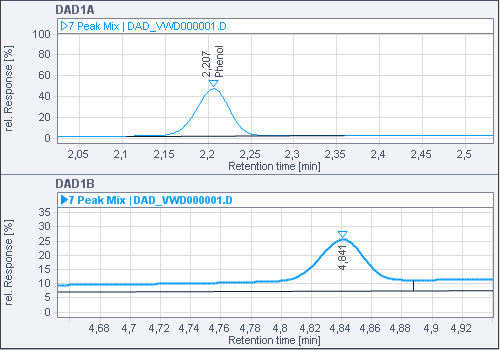
Different samples with same signals
For both samples, the signals DAD1A and DAD1B have been recorded. For the first sample, different peaks have been zoomed: The peak at approx. 2.2 min is shown in signal DAD1A, and the peak at approx. 4.8 min is shown in signal DAD1B.
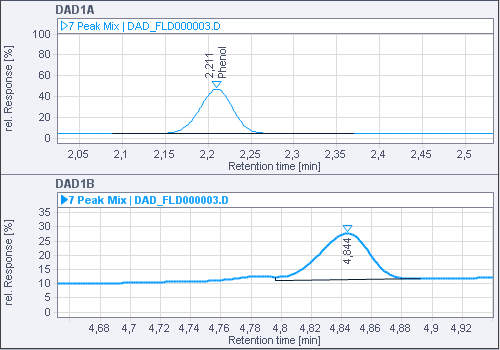
For the second sample, the same signals have been recorded. The zoomed area is kept after selecting this second sample.
Different samples with different signals
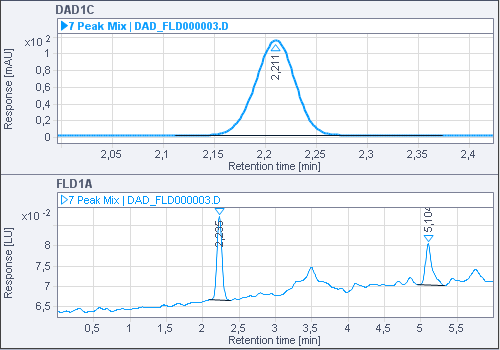
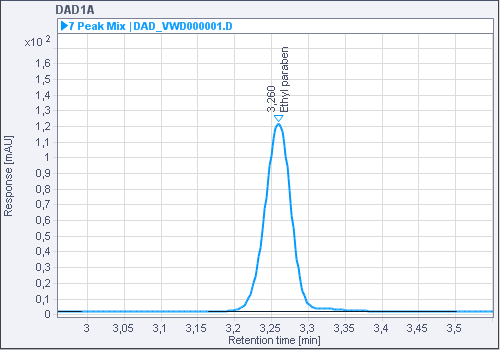
In this example, the signals DAD1C and VWD1A are shown for the first sample. In both signals, single peaks have been zoomed.
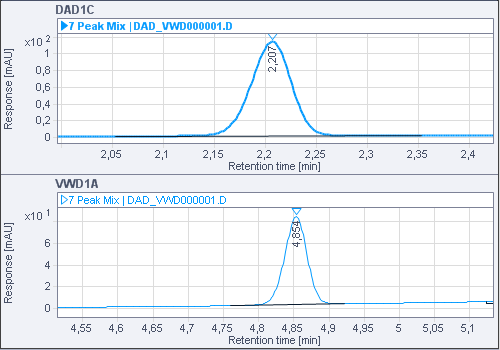
For the second sample, the signals DAD1C and FLD1A are shown. The zooming is kept for the signal DAD1C, as it is the same for both samples. The signal FLD1A is shown without zooming.
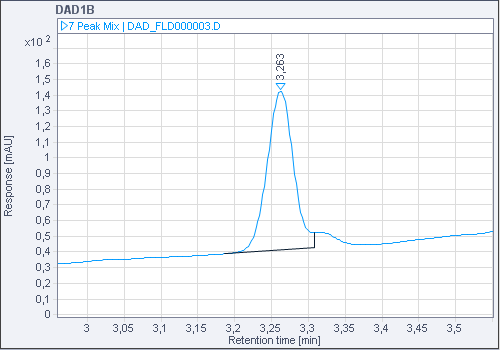
Different signals, but same detector type
In this example, the signals DAD1A and DAD1B are selected in the Signal selection area in the navigation pane. However, for the first sample only the signal DAD1A is available, and for the second sample, there is only the signal DAD1B. Zooming has been applied to the chromatogram of the first sample.
When the second sample is selected, the application notices that the signal comes from the same detector type, and keeps the zoomed area.