Review the results for a specific peak
-
Display the chromatogram containing a specific peak in the Chromatograms window.
-
Select the Results layout from the Layouts ribbon group.
Your workspace now consists of three windows - Chromatograms, Sample Information and Injection Results - as in the following figure:
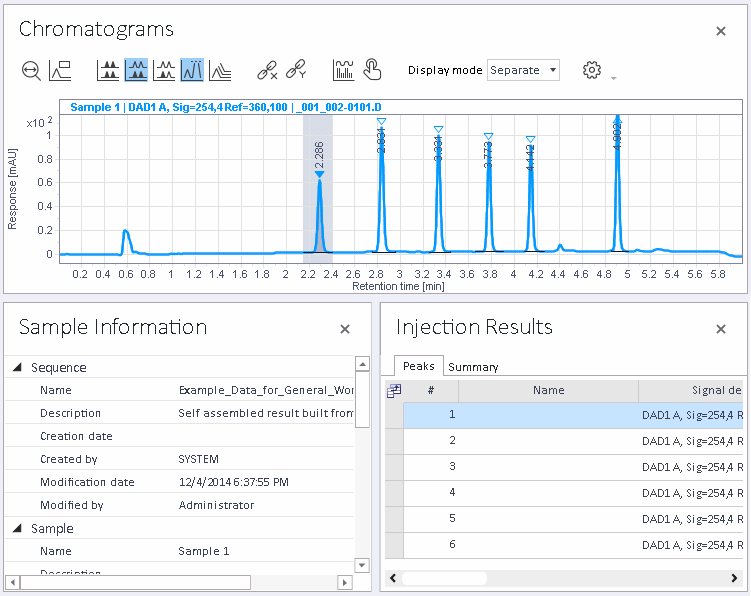
Figure: Results layout -
Click on a specific peak in the Chromatograms window to see more details on this peak in the Injection Results window.
If you have already processed the data, the Injection Results window contains the results, for example Area or Height.
The content of the other windows is synchronized:
The line corresponding to the peak is highlighted in the Injection Results window. Within the Injection Results window, you can switch between peaks by clicking on the different lines.
If a calibration curve is available for the corresponding compound, it is shown in the Calibration Curve window.
Details on the selected peak are shown in the Peak Details window.
If there is a linked processing method, and the peak has been identified, the corresponding compound is selected in the compound tables in the method (in Compounds > Identification , Compounds > Calibration , Compounds > Spectra ), and also in the Injection List window (Compound amounts tab).
base-id: 11015218699
id: 11015218699