Scaling Options and Display Mode
The following examples show a solvent peak with two signals, where one signal is significantly higher than the other. The following figures show a comparison between the display modes Separate and Overlaid. However, the same principle applies to all scenarios where signals are shown first in separate panes and then in a common pane.
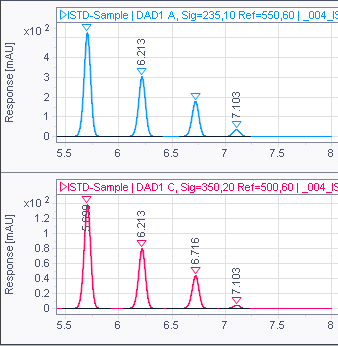
All signals same scale (global)
Both graphs use the same signal scaling. The lower signal does not fill the entire screen.
Separate | Overlaid |
|---|---|
|
|
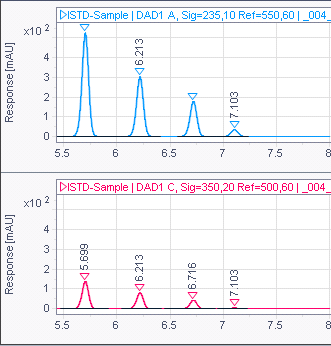
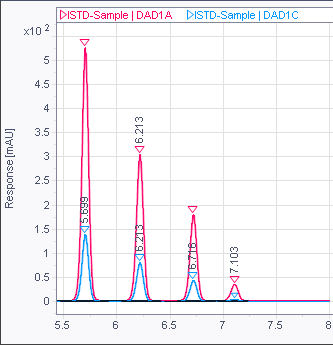
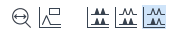
All signals same scale (per pane)
If the graphs are shown separately, each graph is scaled individually to its own signal maximum. If shown as an overlaid graph, the signals use the same scale.
Separate | Overlaid |
|---|---|
|
|

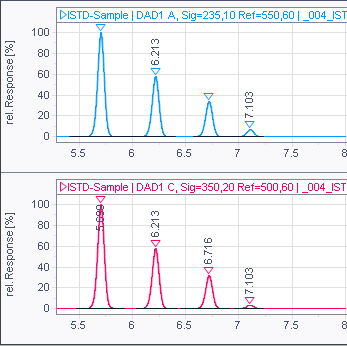
Relative full scale
Each signal is displayed using its own signal maximum (100%).
Separate | Overlaid |
|---|---|
|
|
base-id: 11015418379
id: 11015418379