Zoom and link the x-axes
If you zoom into one of several graphs and then link their x-axes, the zooming area will be applied to the other graphs as well. The following examples are shown with chromatograms using the scaling option All signals same scale (global). They apply to UV spectra and MS spectra as well.
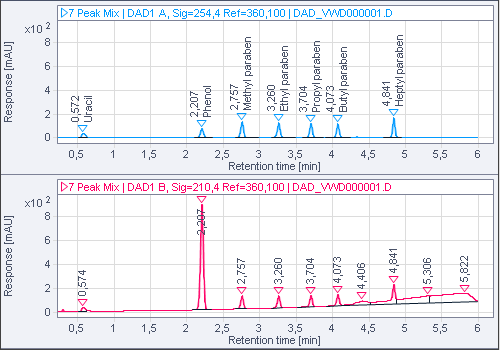
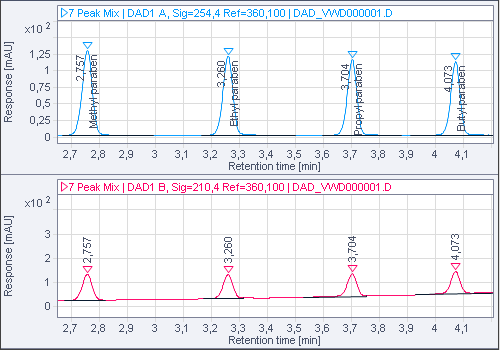
Link the x-axes and zoom into one peak
In this example, two signals are shown for a sample. The x-axes of the two graphs have been linked before zooming in on one of the peaks.
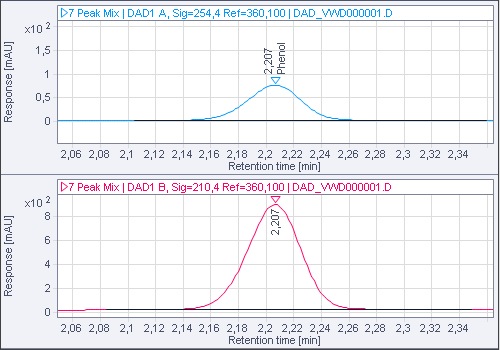
After zooming in on one of the peaks in the first graph: As the x-axes are linked, the x-axis of the second graph is automatically adjusted to the same zoomed area
Zoom into different peaks
In this example, different peaks have been zoomed in on the two signals before linking the x-axes.
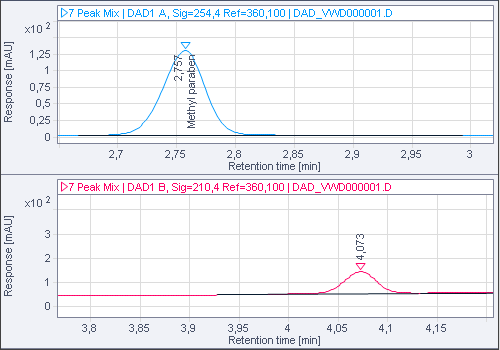
After linking the x-axes, the application uses the smallest common zoomed area for both signals.
base-id: 11015413259
id: 11015413259