Chromatograms
What do you want to do?
Custom Scaling
Select the Apply custom scaling check box to use the options in this dialog. If custom scaling is applied, the system displays only part of the signal, and considers this part of the signal as the entire chromatogram. The following functions are affected:
Zooming out: You can only zoom out as far as custom scaling allows.
Applying Auto scale: The settings of the custom scaling are applied. The system shows the resulting part of the signal.
Showing the overview window: The overview window contains the part of the chromatogram resulting from the custom scaling.
You can choose among the following settings:
Scale to fraction of nth largest peak
The system looks for the nth largest integrated peak, where large can mean either by height or by area. The custom scale is defined by the minimum signal value and the height of this peak. With the fraction parameter, you can use a fractional part of the target peak height for the custom scaling. For example, you can set the fraction value to 50 % or to 200 %.
This option can be useful, for example, for GC chromatograms where the solvent peak is not integrated: With the option Ignore n largest peaks, the system would not ignore the solvent peak, as it is not integrated and therefore not recognized as a peak. In this example, scaling to the first integrated peak would be the most suitable option.
Ignore n largest peaks
The system evaluates the signal maximum of all integrated peaks. The n largest peaks are ignored. Only the minimum and maximum data values of the remaining chromatogram are used to define the custom scale.
This option can be useful, for example, for GC chromatograms, where the solvent peak is integrated and the sample peaks are located on the shoulder of the solvent peak. It can also be useful if the overall baseline is rising or going down to a great extent.
Scale to baseline (i.e. ignore all identified peaks)
The system ignores all integrated peaks. Only the baseline signal is considered for the custom scaling.
This option can be useful to examine the baseline, or to check if there are any not identified peaks that are not, but should have been, integrated.
Chromatogram stacking
Select the Display chromatograms stacked check box to show overlaid chromatograms with an offset. You can use the following settings:
Time offset: Offset value for the time axis
Response offset: Offset value for the response axis
Hide peak annotations in stacked mode: Choose whether you want to show or hide the peak annotations such as retention time or compound name when showing chromatograms in a stacked mode.
Display options
|
Display gridlines |
Clear the check box to hide the gridlines in chromatograms. |
|
Number of panels to display |
Define the number of panels that are visible at the same time in the Chromatograms window. If there are more panels available than the given number, a scroll bar will be added. |
Peak filling
|
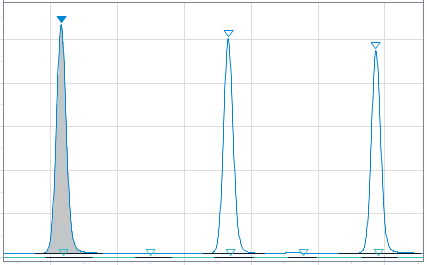
Show selected peak filled |
The selected peak is shown filled with a medium gray color.
|
|
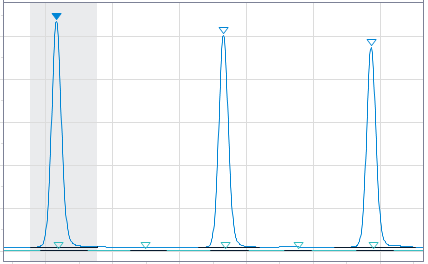
Highlight time range of selected peak |
The time range of the selected peak is shown with a light gray background.
|
base-id: 11012061963
id: 11012061963