EZChrom Integration events
You can set the values either specifically for a given signal or globally for all signals. To add a timed event, right-click in the parameters table.
There are different types of integration events: For some of them, you can define a time range with start and stop time during which a parameter is active. For others, you can define a specific value to be used from a start time or during a time range. The columns Time Stop [min] and Value are enabled or grayed out, depending on the type of event.
NOTE
Other than in OpenLab EZChrom, the stop time is grayed out for the following integration events in OpenLab CDS:
Width
Threshold
Shoulder sensitivity
Minimum area
Reset baseline
Reset baseline at valley
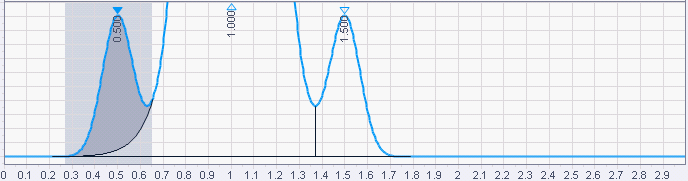
Width
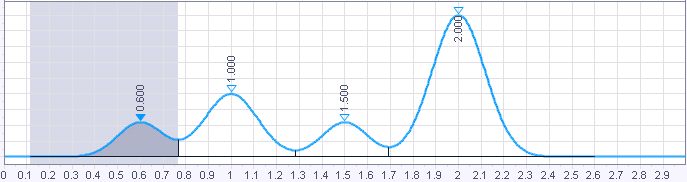
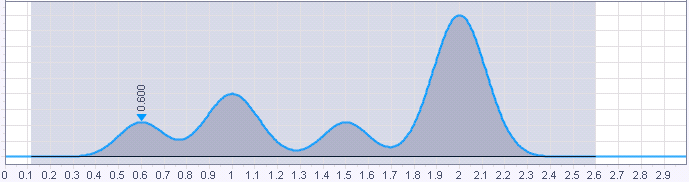
Used to distinguish true peaks from noise. The system uses the default value of width = 0.2 min.
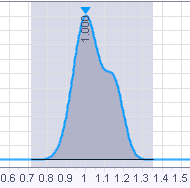
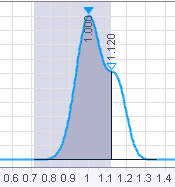
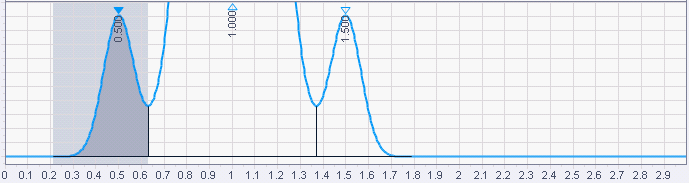
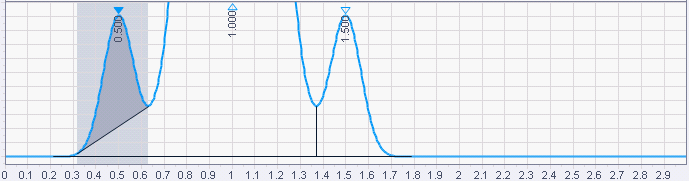
The Width event is used to calculate a value for bunching, or smoothing, the data points before the integration algorithm is applied. Integration works best when there are 20 points across a peak. If a peak is over sampled (i.e. the sampling frequency was too high), the Width parameter will be used to average the data such that the integration algorithm sees only 20 points across the peak.
A Width event will be applied to a given peak as long as it occurs before or on the apex of the peak.
The Width parameter is only used to correct for over-sampling. It cannot correct for data that was under-sampled (i.e. sampling frequency too low causing fewer than 20 points acquired across the narrowest peak).
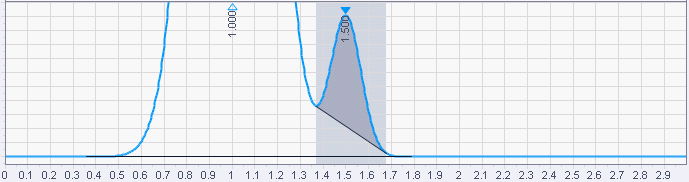
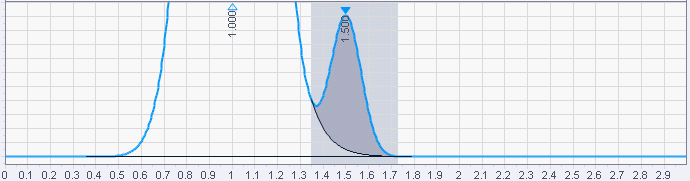
The diagrams below show examples of how incorrect values can effect the peak baseline.
NOTE
In most circumstances, an initial Width value based on the narrowest peak in the chromatogram will be adequate for proper integration of all peaks. However, a new Width timed event should be entered every time a peak width doubles.
NOTE
Extreme values of both Width and Threshold (too large or too small) can result in peaks not being detected.
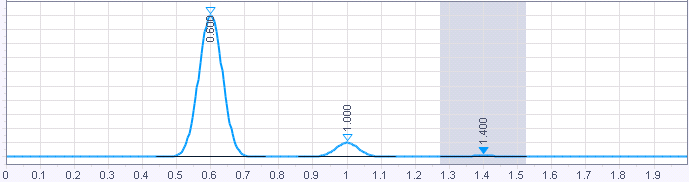
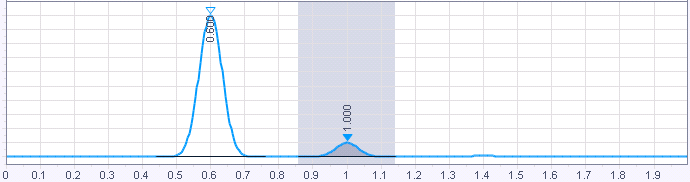
Threshold
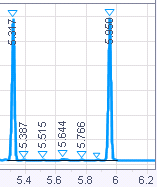
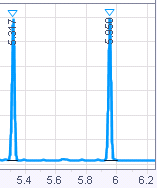
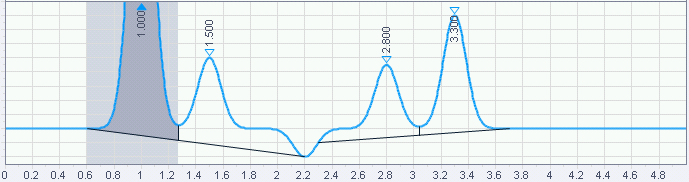
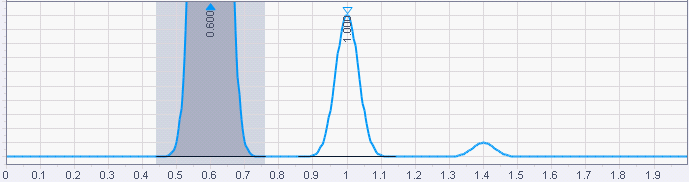
This parameter is the first derivative, used to allow the integration algorithm to distinguish the start and stop of peaks from baseline noise and drift. The Threshold value is based on the highest first derivative value determined in a section of the chromatogram.
The diagrams below show examples of how incorrect values can effect the peak baseline.
NOTE
Extreme values of both Width and Threshold (too large or too small) can result in peaks not being detected.
Shoulder sensitivity
This parameter is used to enable the detection of shoulders on larger peaks. A larger value will decrease shoulder sensitivity while smaller values increase sensitivity to shoulder peaks. The Shoulder Sensitivity value is based on the highest second derivative value determined in a section of the chromatogram.
Integration off
This event turns off the integration of your chromatogram during the range specified. This event is useful if you are not interested in certain areas of your chromatogram, and do not wish peaks to be reported for that section.
When using Integration Off to disable peaks, these regions will be included in the noise calculation. Leave all peaks integrated to get the correct noise values.
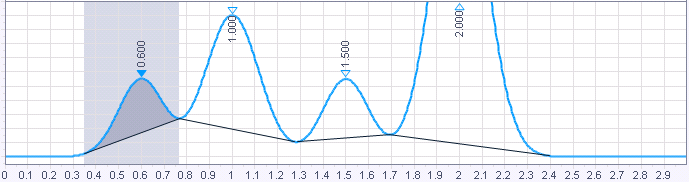
Valley to valley
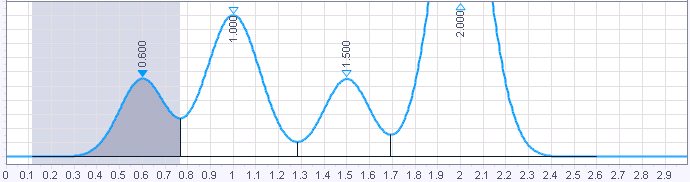
This event causes the baselines of peaks that are not totally resolved (i.e. do not return to baseline) to be drawn to the minimum point between the peaks.
If this event is not used, a baseline is projected to the next point at which the chromatogram returns to baseline, and a perpendicular is dropped for peaks which do not reach baseline.
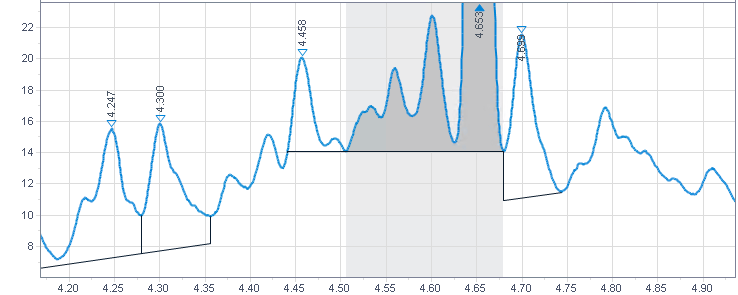
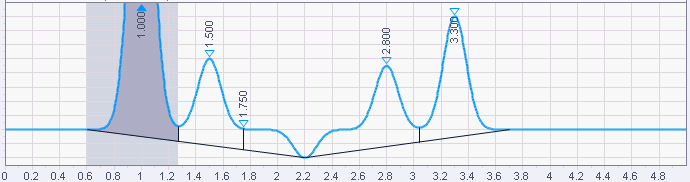
Horizontal baseline
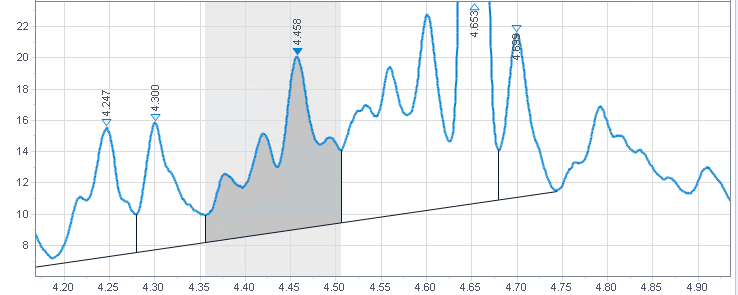
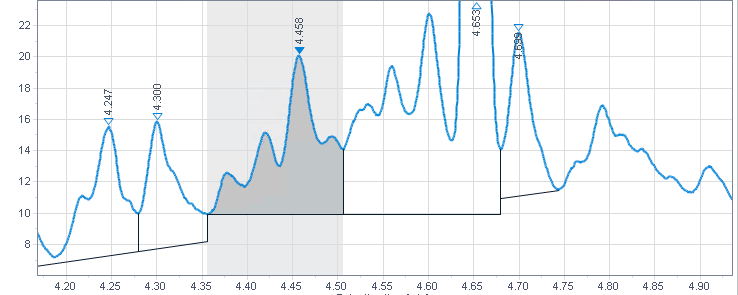
This event allows you to project the baseline forward horizontally for the peaks within the specified time range. The baseline starts where the first peak within the defined time range begins. The end of the baseline is where it intersects the signal, or where the last peak ends.
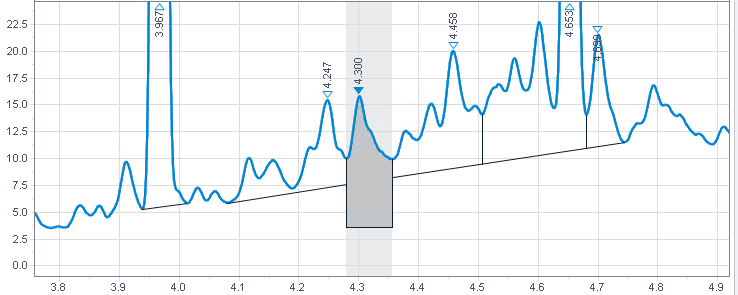
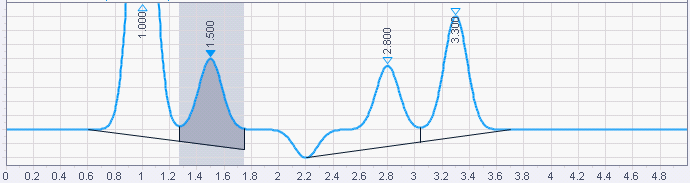
Backward horizontal baseline
This event is used to force a horizontal baseline in the direction of the beginning of the chromatogram. A backward horizontal baseline will be created for the peaks within the specified time range. The baseline is defined by the end of the last peak within the defined time range ends. It is projected back to where it intersects the signal, or where the first peak begins.
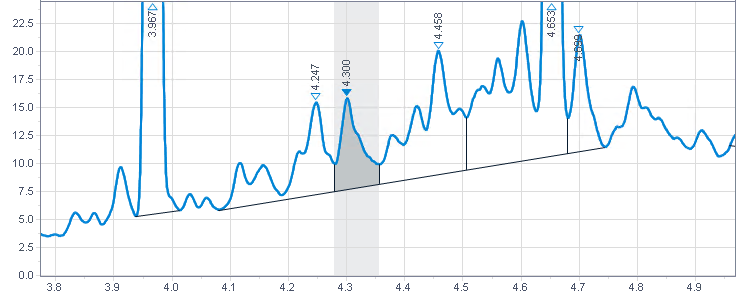
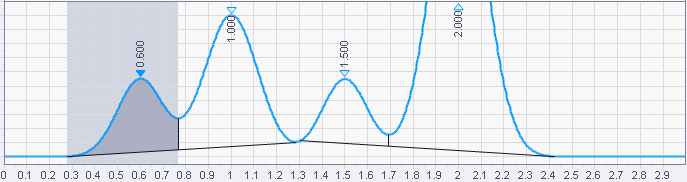
Lowest point horizontal baseline
This event is applied to all peaks whose retention times fall within the time range defined by Time (min) and Time Stop (min).
The Value defines the time where the integrator starts to search for the lowest baseline point.
Tangent skim
This event is used to integrate a small peak located on the tailing edge of a larger peak. The baseline of the small peak becomes a tangent drawn from the valley of the larger peak to the tangent point on the chromatogram.
Front tangent skim
This event is used to force a tangential baseline for a daughter peak on the leading edge of a mother peak.
Exponential skim
This event is used to integrate small peaks located on the tailing edge of a larger peak. The baseline of the small peak becomes an exponential drawn from the valley of the larger peak to the tangent point on the chromatogram.
Front exponential skim
This event is used to force an exponential baseline for a daughter peak on the leading edge of a mother peak.
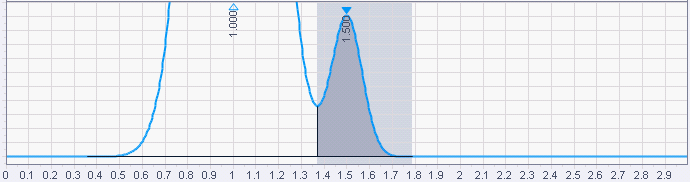
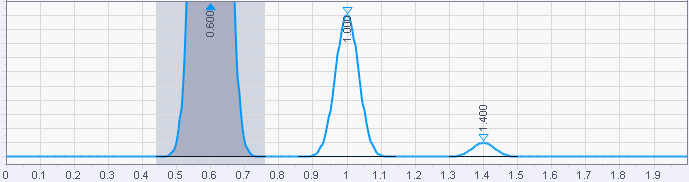
Minimum area
This event allows you to enter an area limit for peak detection. Peaks whose areas fall below this minimum area will not be integrated and reported as peaks. This event is useful for eliminating noise or contaminant peaks from your report.
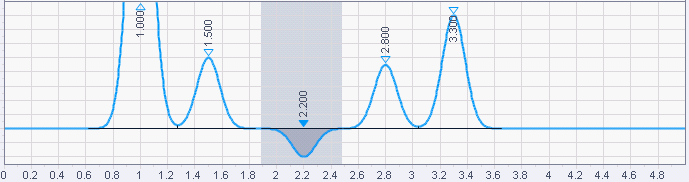
Negative peak
This event causes portions of the chromatogram that drop below the baseline to be integrated using the normal peak logic and reported as true peaks. This event is useful when using detectors such as Refractive Index types which give a negative response to certain compounds.

Disable end of peak detection
This event is used to turn off end of peak detection between the specified times, forcing the software to treat peaks falling within the window of the event as a single peak. This event is a useful way to combine the areas of a series of contiguous peaks into one area. Because the peaks are considered to be part of a single peak, the retention time is assigned to the time of the first apex after the Disable End of Peak Detection event.
Manual baseline
This event allows you to change the way the baseline for a peak is drawn without changing the integration parameters. The baseline will be drawn from the signal at the start time to the signal at the stop time.
This is convenient when you want to change where a baseline is drawn for a peak without changing how the baseline is drawn for other peaks in the chromatogram.
Manual peak
This command allows you to define the start and stop time of a peak that was not previously detected. This is convenient when you want to force integration of a peak, but do not want to change your overall integration parameters.
Split peak
This event is used to force a perpendicular drop-line integration in a peak. The perpendicular will be dropped at the time where the event is inserted.
Force peak start / Force peak end
These events are used to force the start or stop of the peak integration to a specific point.
Reset baseline
This event lets you set the baseline at a designated point on the chromatogram.
Reset baseline at valley
This event will cause the baseline to be reset at the next valley detected after the event.
NOTE
The event should be placed after the start of the first peak in the cluster; otherwise the start of the peak will be identified as the valley.
Maximum area
Sets the area of the largest peak of interest.
Any peaks that have areas greater than the maximum area are not reported: The integrator rejects any peaks that are greater than the maximum area value after baseline correction.
You can use this event, for example, to exclude the solvent peak of a GC chromatogram from the integration results, but include its rider peaks.
Maximum height
Sets the height of the largest peak of interest.
Any peaks that have heights greater than the maximum height are not reported: The integrator rejects any peaks that are higher than the maximum height value after baseline correction.
You can use this event, for example, to exclude the solvent peak of a GC chromatogram from the integration results, but include its rider peaks.
base-id: 11138146699
id: 9007210392887691