Peak details
What do you want to do?
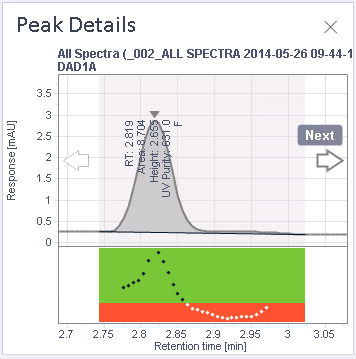
This window shows details on the peak selected in the chromatogram. The header of the window shows the sample name, the name of the data file, and the signal. Details on the peak include time, area, height, and compound name. The peak is enlarged so that you can easily check its appearance.
If you have calculated UV purity values, the purity ratio curve is shown in the lower part of the window, and the UV purity value is shown as a peak annotation. For details on the calculation, see Impurity evaluation).
If you have calculated System Suitability values, the tangents and peak widths are shown in the peak details. The displayed peak widths are from top to bottom: 50 %, 10 %, 5 %, and 5 sigma.
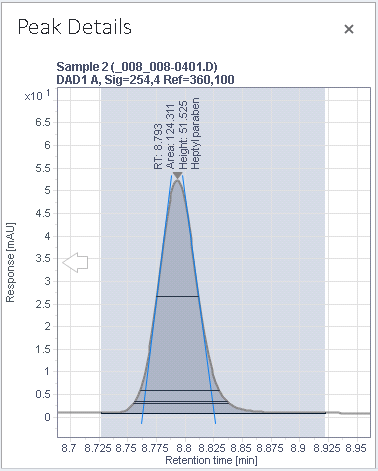
With the arrows to the left and right of the peak, you can navigate to the previous or to the next peak in the chromatogram. The peak selection is synchronized with the selections in other windows (see Data Synchronization).
base-id: 11012230795
id: 11012230795