Specify Online Signals to display
Select Method > MSD > Chromatograms.
In the Real Time Plots area:
To display a Total Ion Chromatogram in the Online Signals window click Display.
To display a Base Peak Chromatogram in the Online Signals window click Display.
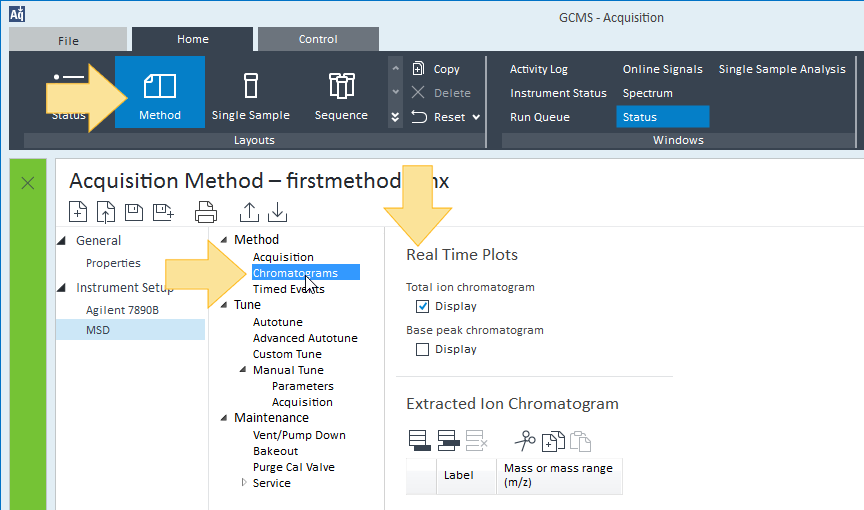
To display one or more Extracted Ion Chromatograms (EIC):
Click
 to add a row to the Extracted
Ion Chromatograms table. To insert a row above an existing
row, select the row and click
to add a row to the Extracted
Ion Chromatograms table. To insert a row above an existing
row, select the row and click  . To delete a row click
  . For a functional
description of all icons used with this table see Table
Icons.
. For a functional
description of all icons used with this table see Table
Icons.Enter a Label to identify the generated EIC during sample acquisition in the Online Signals window.
In the Mass or Mass Range column enter an m/z value for a single ion. If needed, specify an EIC mass range by entering a low m/z value hyphen separated from a high m/z value defining an m/z range.
Repeat the above steps to plot an additional EIC if required. A total of 12 plots are allowed.
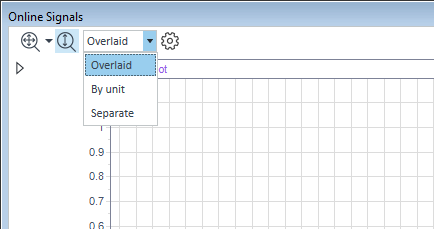
Click Online Signals.
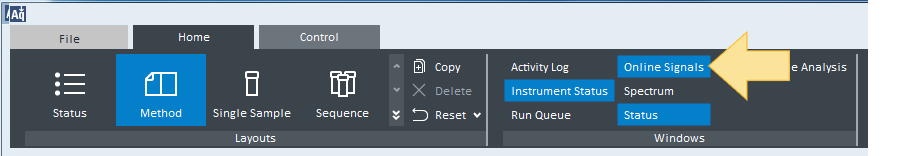
The selected chromatograms will be displayed in the online signals box during each run. Select from the list to show the signals as you wish.