UV/Vis Spectra
With the available spectra snippets, you can create graphs for different scenarios:
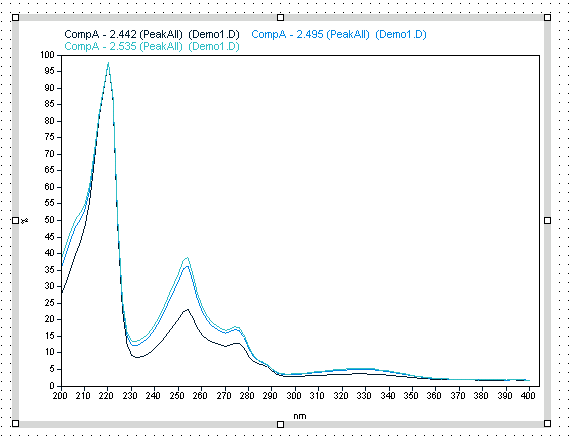
The Spectra Plot snippet contains a plot where all available spectra are shown in an overlaid format. By default, the spectra are grouped by peak, and multiple spectra selected from the same peak are shown in an overlaid graph.
This snippet is typically used in combination with a composite group that is repeated on a specific information, depending on your requirements. You can, for example, create a composite group that is repeated by sample name; inside this composite group, the Spectra Plot snippet will show one graph for each peak, with overlaid spectra for all injections of the current sample.
-
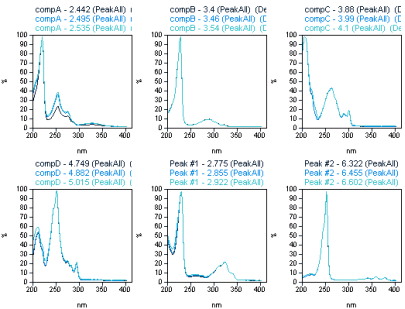
The Spectra Plot All Peaks snippet contains a plot that is embedded in two composite groups. The first composite group is repeated on the signal name, the second composite group is repeated on the peak ID. Thus, you obtain a single spectrum for each peak and signal.
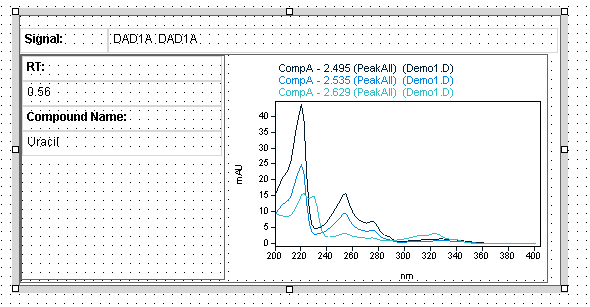
The Spectra Plot Compounds snippet contains a plot that is embedded in a single composite group. The composite group is repeated on the peak ID, and it also contains the retention time and the compound name for each peak. If there are multiple signals, this snippet uses only the peaks of the main signal.
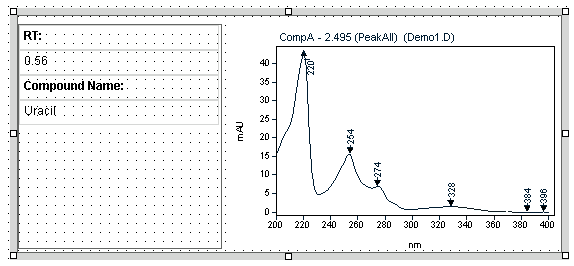
The Spectra Plot per Peak snippet is repeated by peak, that is, the entire report item is displayed once for each peak in the generated report. You cannot remove the repeating by peak in the report item properties. Multiple spectra selected from the same peak are shown in an overlaid graph.