Show impurity check annotations
If the data contains information on peak purity, use one of the following snippets to show the results graphically in the chromatogram:
-
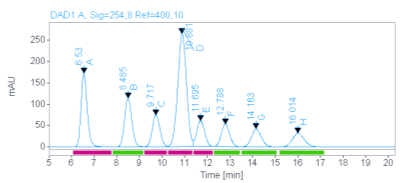
Chromatograms > Peak Purity - Simple
In this snippet, the property Peak Labels > Peak Purity Annotation > Show Impurity Check Annotation > Flag Impurity Status is selected.
To display peak purity annotations, make sure that the correct signal is displayed in the chromatogram:
For MS data, filter the data by the signal name Signal_Name like "*TIC SCAN*" and set the value to true.
-
For UV data, filter the data by the signal name Signal_Name like "*DAD*" and set the value to true.
-
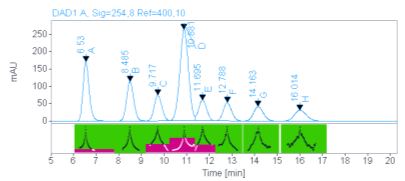
Chromatograms > Peak Purity - Curve (for UV data only)
In this snippet, the property Peak Labels > Peak Purity Annotation > Show Impurity Check Annotation > Draw Impurity Check Curve is selected.
|
As long as peak purity results are available for at least one peak, the flags or curves are shown for all peaks. |