MS Sample Purity Results
With the Tables > MS Results > MS Sample Purity Results snippet, you add a predefined table with MS targets (names, masses and formulas), and the calculated purity values.
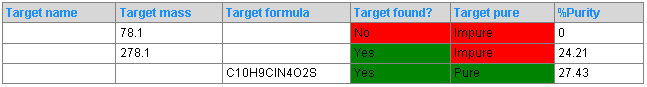
The Target found and Target pure columns are automatically colored corresponding to the values. A sample is evaluated as pure if %Purity is higher than a defined threshold value. The threshold value is part of the data.
Peak filling in chromatogram
To have pure peaks filled with a different color in the chromatogram, go to the Chromatogram Properties > Peak Labels page. Under Peak Filling, use the field Peak_SamplePurityPassed in an expression for the color.
For example:
=iif(Peak_SamplePurityPassed like "", "Gray", iif(Peak_SamplePurityPassed, "Green", "Red"))
This expression returns the color gray if no target has not been found, or the color green or red depending on the purity.