MS Spectra Plots
OpenLab CDS offers several snippets to display MS spectra. For example:
MS Spectra Plot
Select the Spectra > MS Spectra Plot snippet to display all MS spectra of a signal in one report item. The spectra will be shown in Profile or Centroid mode as defined in your data acquisition method.
By default, each spectrum is shown in full scale (100%), and the maximum abundance is shown for each spectrum.
|
The MS Spectra Plot snippet shows MS spectra of all integrated peaks in the TIC - even if these spectra are not listed in the injection tree of the Data Processing view. To show less spectra, adjust the filter conditions. |
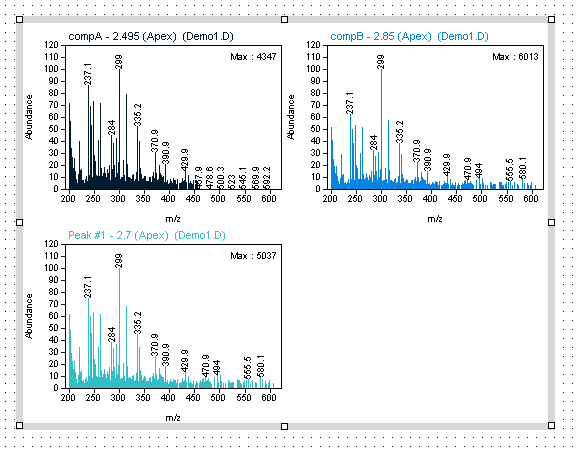
MS Spectra Plot report item, centroid mode
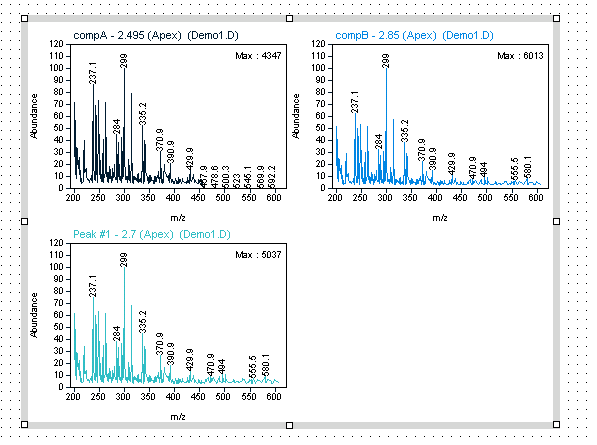
MS Spectra Plot report item, profile mode
MS Spectrum Overlaid
Select the Spectra > MS Spectrum Overlaid snippet to display the spectra for the selected peaks in the Overlaid format. The spectra will be shown in Profile or Centroid mode as defined in your data acquisition method.
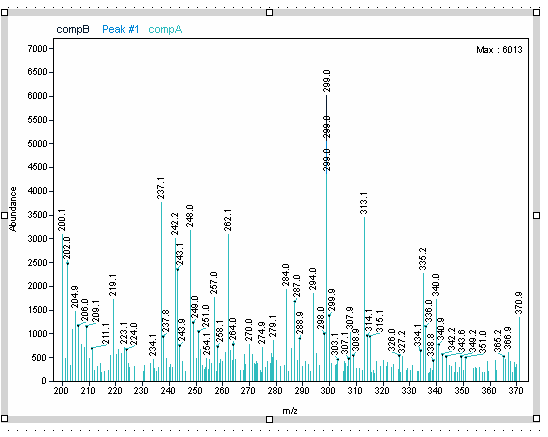
MS Spectrum Overlaid report item
Flow Layout
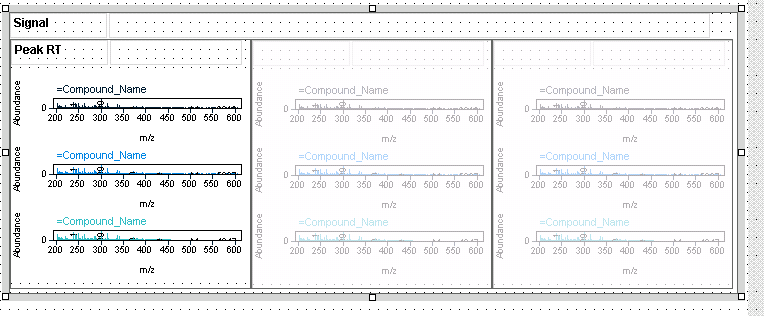
Spectra > MS Spectra Flowlayout shows the MS spectra embedded in a group that is repeated on signals and peaks. You can add more information to the group, such as the peak retention time.
MS Ion List Per Peak
Select the Spectra > MS Ion List Per Peak snippet to display the spectra plot and the MS Peak table for the selected peaks. The MS peak table shows the values for m/z, Abundance, and Abundance % for the peak MS spectrum.
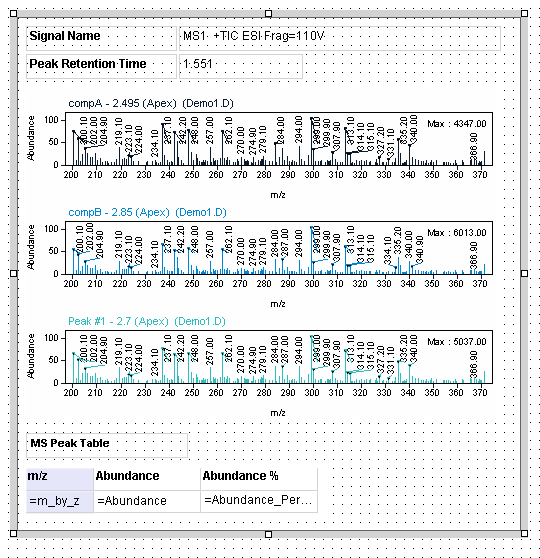
MS Ion List Per Peak report item