Choose peak filling based on expression
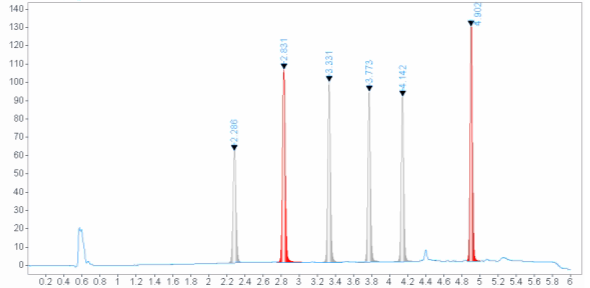
You can use an expression to have the peaks automatically filled with specific colors. This allows you to show peaks with specific properties in a different color. For example, you can use a report parameter for the peak area, and fill all peaks with an area greater than the given value with a red color.
In the Report Properties, add a report parameter (e.g. Report_Parameter_0) of type Integer.
In the Chromatogram Properties, select the Peak Labels page.
Under Peak Filling, select a fill type, e.g. Gradient type 3. Select Use Color and choose <Expression...>.
In the Expression Editor, enter the required expression. For example:
=iif(Peak_Area > Report_Parameter_0, "Red", "DarkGray")
The color and their names are listed in a separate node in the lower left panel.
In the report preview, provide a value for the report parameter. All peaks with an area greater than this value will be shown with a red filling.