Start Screen
The Start screen gives an overview of your instruments and their states, as well as your personal or entire lab queue of analyses and their states. It also serves as an access point to more detailed information and respective toolsets. The display is dependent on your Sample Scheduler privileges.
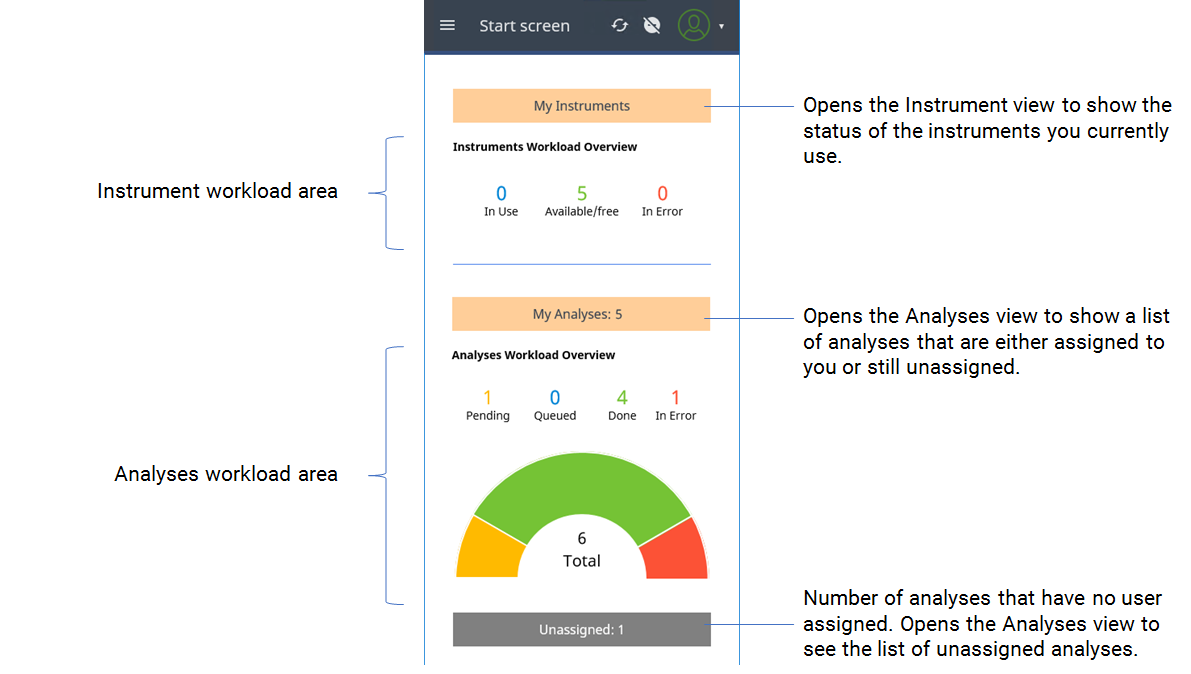
Instrument workload area
Displays the number of instruments you have access to and that are currently in use, free, or in error. This area is only visible if you have the privilege View lab manager start page.
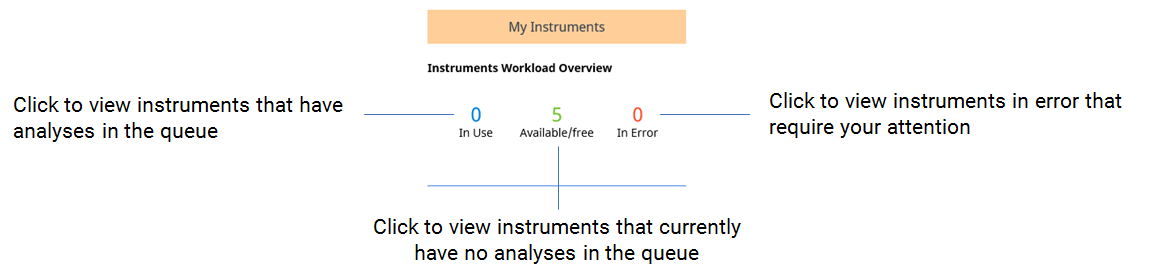
Here you get an overview of the status and workload of your instruments at a glance. The instruments are categorized according to their workload state, with their number being displayed for each workload state:
In Use | All instruments whose analyses and sequences are scheduled, submitted, or in progress. |
Available/free | All instruments without assigned analyses (and sequences) or with assigned analyses (and sequences) that are ended or require a specific action before they can be queued (such as holding, incomplete, or waiting). |
In Error | All instruments in error state. |
Click or tap on a category or its number to view the workload of each instrument. The Instrument view then shows only the instruments corresponding to the selected category.
Analyses workload area
Use the My Analyses button to display only the analyses that are assigned to you.
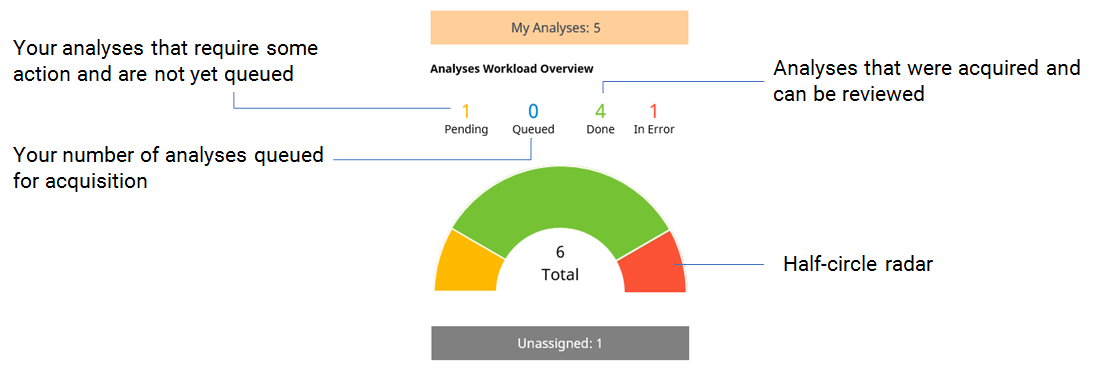
The half-circle radar displays an overview of today's workload:
The radar gives an overview of your authorized analyses and categorizes them by workload state.
Above the radar, the number of analyses for each workload state is displayed. This also includes analyses contained in sequences.
For analyses in sequences, only the sequence state is relevant. All included analyses are attributed to the state of the sequence, regardless of their individual analysis states.
Below the radar, the total number of analyses is displayed. This also includes the number of analyses contained in a sequence.
These workload states are available:
| All analyses that require a specific user action before they can be queued. States: Holding, Incomplete, Edited by, Waiting, Waiting on error, Stopping, Stopped. |
| All analyses in process. If a sequence is running, all included analyses are counted as Queued. States: Scheduled, Submitted, In progress, Not available. |
| All analyses in ended state that can be reviewed. Analyses that are transferred to LIMS (state: Transferred to LIMS) are also included. |
| All analyses in error state that require an action to correct the error. Select this state to view their categorized analyses and to display the error information. |


NOTE
Analyses in Ended state are automatically deleted according to the command life time specified in the Sample Scheduler configuration under System Configuration > Command default values > Default analysis life time . For more information, refer to Command default values.
If LIMS connections are configured, the command life time is defined under LIMS > Analysis life time . For more information, refer to LIMS configuration parameters.
Click or tap on a workload state or its number to view analyses with a specific workload state.
Unassigned analyses
The Unassigned bar below the half-circle radar displays the total number of analyses in the Sample Scheduler database that are not assigned to a user. This also includes the number of analyses contained in an unassigned sequence. Use this button to view only unassigned analyses.
Subpages
base-id: 11194541963
id: 9007210449282955