Set number of panels to be shown
-
Click the Properties icon
 in the toolbar.
 -
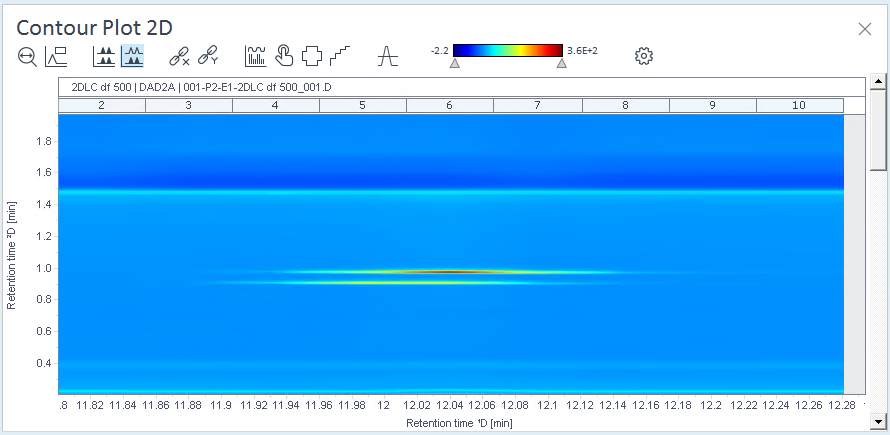
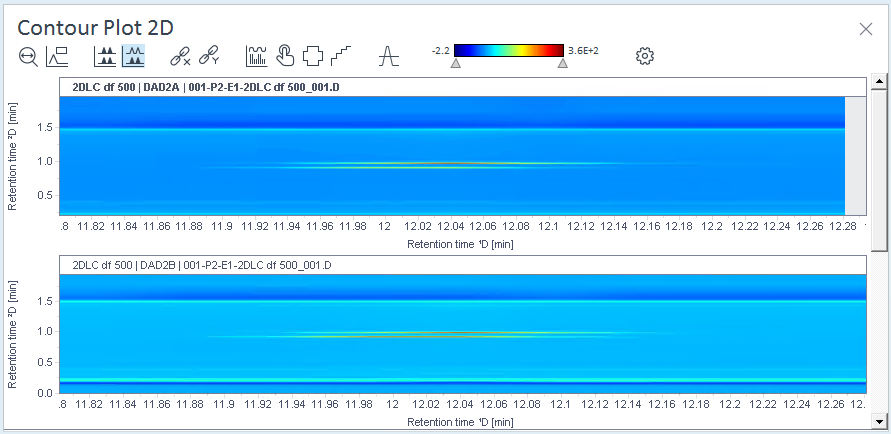
Under Display options, choose the number of panels to display. If there are more 2D signals, a scrollbar is shown in the contour plot to access them.
-
Confirm your changes.
base-id: 10237163019
id: 10237163019