Export a graph with data of the 2nd dimension
Several export functions are available for graphs with ²D data. If not stated otherwise, the following descriptions are valid for the Chromatograms ²D window as well as for Diagnostic Signals, Contour Plot 2D, MS Spectrum and UV Spectrum.
-
Select the required signals and cuts.
-
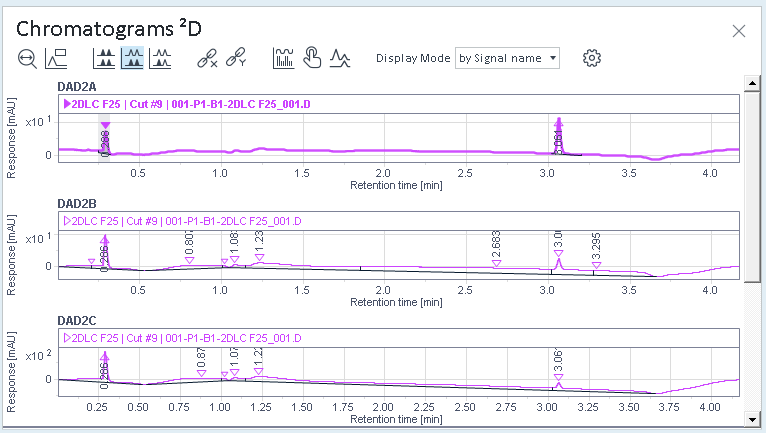
Chromatograms ²D and Diagnostic Signals: Choose a suitable display mode.
-
Right-click the graph, and select one of the following commands from the context menu:
Copy to clipboard: After using this command, you can paste the content as a graphic into an Office software such as Word or PowerPoint, or into any image editing software.
If you paste directly into an Office software, the content is pasted as a vector graphic, which can be displayed in a higher quality. If you paste into an image editing software such as Paint, the vector information is lost and only a pixel graphic with a lower quality is pasted.
Export to file ...: In a Select Folder dialog, you can choose the folder and the file type for the graphic file. If required, click New folder to create a new folder.
Choose the *.emf file type to save as a vector graphic for usage in Office software such as Word or PowerPoint. Choose *.png to save as a pixel graphic.
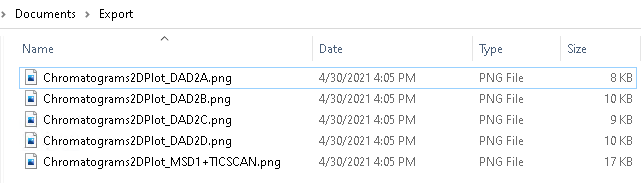
Chromatograms ²D and Diagnostic Signals: If you export the content window that shows several separate panes, for example with the display mode by Signal name, separate images are generated for each pane. See the following example.
base-id: 10237203595
id: 10237203595