Extract a spectrum from the Contour Plot 2D
Prerequisites
|
With the context menu
-
Show a full 2D signal or a compound region in the Contour Plot 2D window.
-
Make sure there is a method linked to your data.
-
To focus the signal, click on the signal title in the Contour Plot 2D.
If the spectrum extraction tool is activated, click the icon in the Contour Plot 2D toolbar to deactivate it:

-
In the contour plot, right-click a 2D peak, then select Extract spectrum at 2D peak apex.
This extracts the spectrum at the apex of the ²D peak. If the 2D peak includes several cuts, the spectrum is extracted from the ²D peak with highest response.
The extracted MS or UV spectrum is shown in the MS Spectrum or UV Spectrum window, respectively.
With the spectrum extraction tool
-
Show a full 2D signal or a compound region in the Contour Plot 2D window.
-
Make sure there is a method linked to your data.
-
To focus the signal, click on the signal title in the Contour Plot 2D.
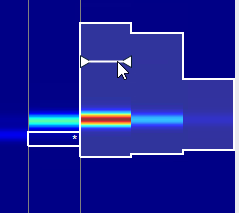
Click the spectrum extraction icon in the Contour Plot 2D toolbar:
-
Move the mouse over the contour plot. The cursor changes dynamically, for example, if you move it over a peak apex or a baseline.
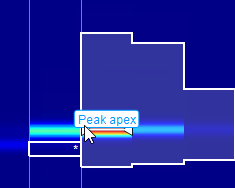
The indicator snaps in at the following points:
Peak apex
Baseline point
Dropline point
-
Click at the required position, and click
 or press ENTER to confirm the spectrum
extraction.
or press ENTER to confirm the spectrum
extraction.The extracted MS or UV spectrum is shown in the MS Spectrum or UV Spectrum window, respectively.
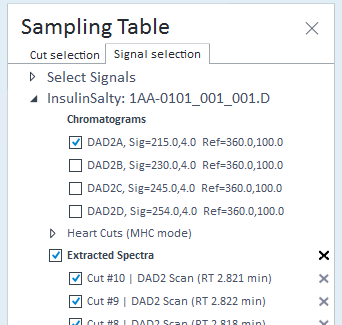
All extracted spectra from the 2D dimension signal are listed in the Signal Selection tab of the Sampling Table window.
base-id: 10237180171
id: 10237180171