Peak Table ²D
What do you want to do?
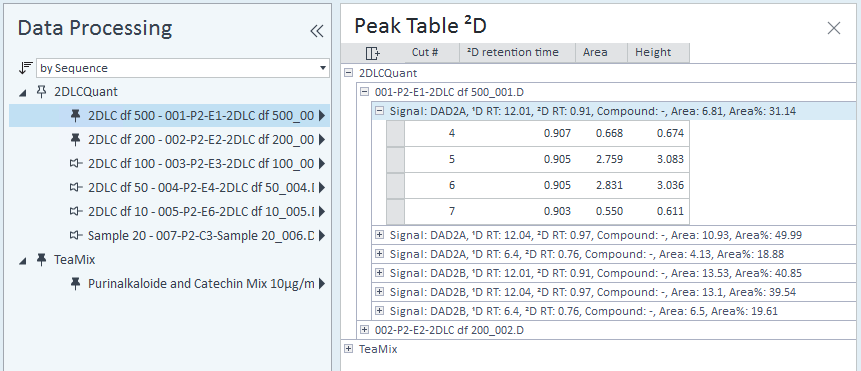
The Peak Table ²D window shows the results for each single ²D peak. The available values are similar to the ones for 1D and 2D peaks shown in the Injection Results window. In addition, you can show the Cut #, Deck, and Loop for each ²D peak.
The data is arranged by 2D peaks. If you pinned multiple injections from several result sets, it is additionally arranged by injection and result set.
To expand or collapse a section, click the  or
or  icons, or right-click a section and select Expand or Collapse from the context menu.
The section heading for each 2D peak includes its signal name, ¹D retention time, ²D retention time, compound name, area, and area %.
base-id: 10237190795
id: 10237190795