Show compound labels in the contour plot
-
Click the Properties icon
 in the toolbar.
 -
Select the Contour Plot 2D page.
-
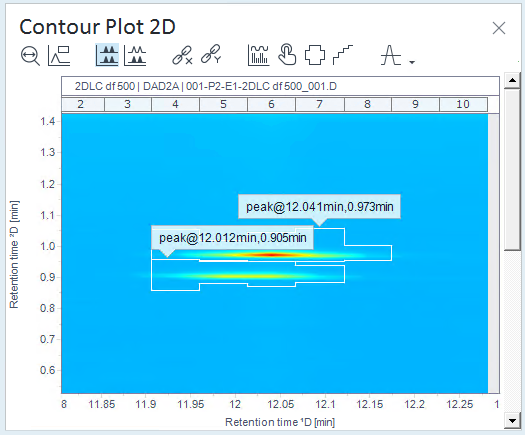
Select the Show compound labels check box.
-
Click OK.
For identified 2D peaks, peak regions and labels are shown in the contour plot.
base-id: 10237166987
id: 10237166987