Chromatograms ¹D
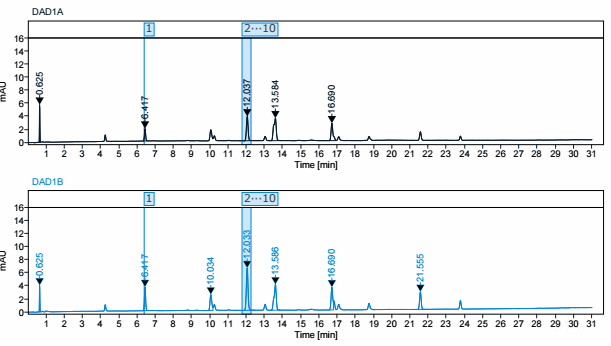
With the 2D-LC > Chromatograms ¹D snippet, you add a multi signal plot to your report. The plot is filtered so that only ¹D chromatograms are shown.
With 2D-LC data, the Chromatogram Properties > Peak Labels page contains an additional check box: Select or clear the Show 2D LC Annotations check box to show or hide the cut annotations.
For more information, see Chromatograms
base-id: 10237647755
id: 10237647755