Review results for 2D peaks
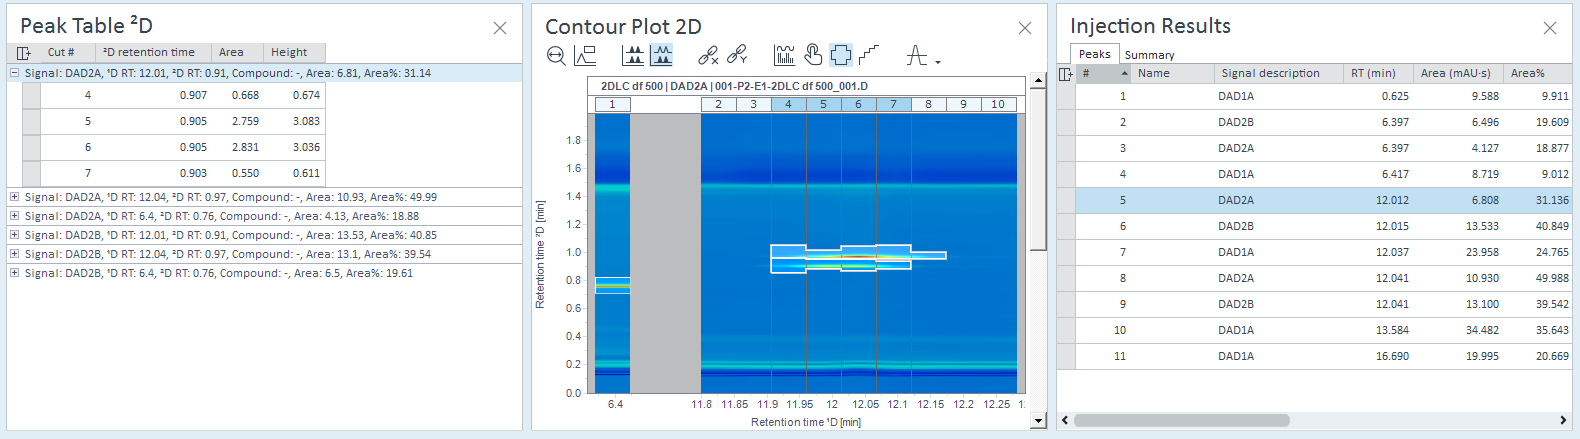
The results for a 2D peak are shown in the Injection Results window.
To find the correct 2D peak, you can select it in the Peak Table ²D window or in the Contour Plot 2D window. All windows are synchronized.
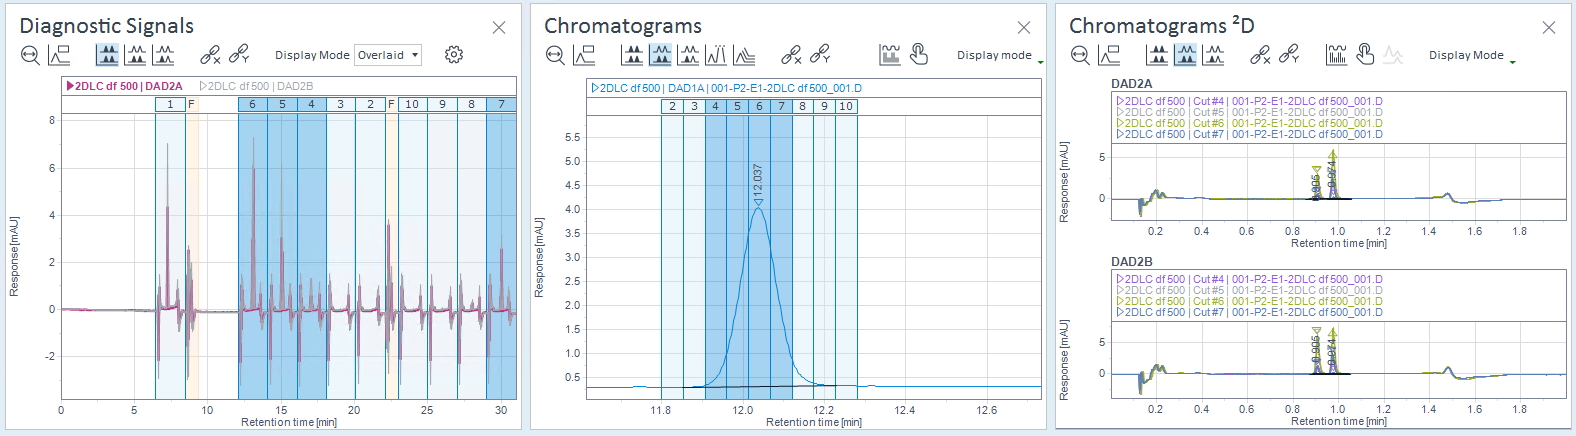
All cuts that contain the contributing ²D peaks are selected in the Chromatograms window and in the Diagnostic Signals window. The Chromatograms ²D window shows the corresponding ²D cut chromatograms.
base-id: 10237195659
id: 10237195659