Show cut annotations
Cut annotations are available for graphs in the windows Chromatograms, Contour Plot 2D, and Diagnostic Signals.
-
Click the Properties icon
 in the toolbar of the
Chromatograms window.
in the toolbar of the
Chromatograms window. -
On the top page, under Display options, select Show cut annotations (for the Chromatograms window, select this setting on the Cut annotations page).
In the Chromatograms and Diagnostic Signals windows, cuts are displayed with a colored background. A header above the graph displays the cut numbers.
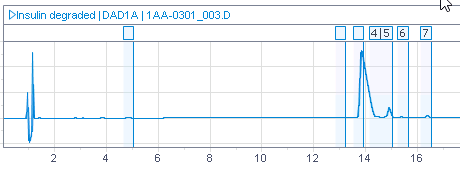
그림: Chromatogram with cut annotations 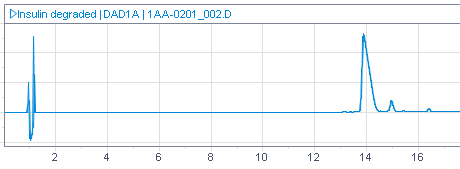
그림: Chromatogram without cut annotations In the Contour Plot 2D window, a header above the graph displays the cut numbers.
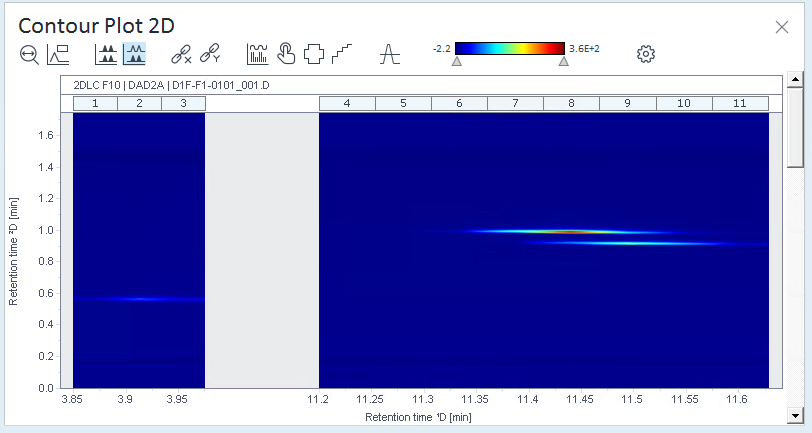
그림: Contour plot with cut annotations
View details on cuts
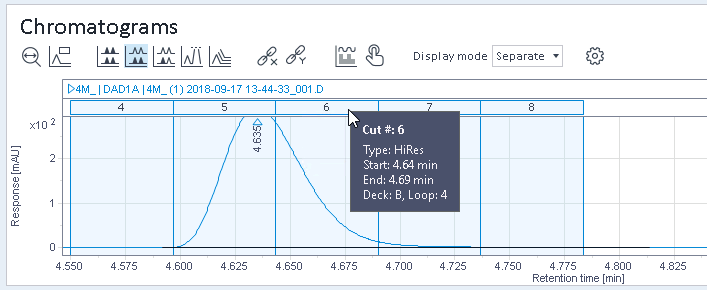
Cut details are displayed in the Chromatograms, Contour Plot 2D, and Diagnostic Signals windows. The following procedure shows an example of how to view cut details in the Chromatograms window.
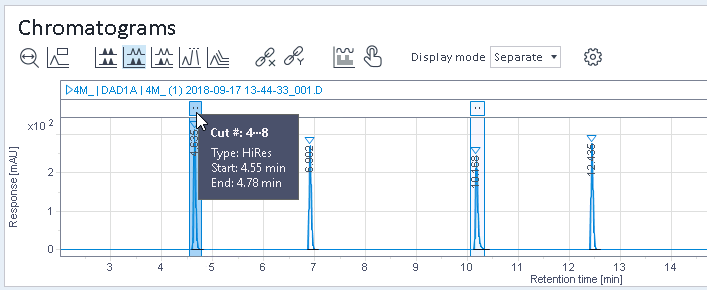
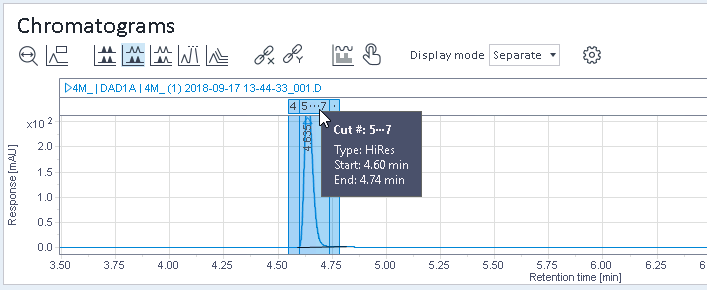
In the window, ensure that cuts are displayed (see Show cut annotations). Move the mouse over the cut annotation header. If space allows, the header shows the cut number(s).
A tool tip shows additional information such as cut number, type of 2D-LC sampling (MHC, HiRes, etc.), start time, end time and, if available, information about the used deck and loop.
If single cuts are too small to display, the cuts are combined into larger blocks. The tool tip shows the numbers of the included cuts. Zoom in on the graph to see all details of the cut annotation.
base-id: 10237224075
id: 10237224075