Show UV Peak purity in the Contour Plot 2D
In the Contour Plot 2D window, click
 to show the results of the UV purity check.
If UV impurity has been evaluated, that is, similarity values have been calculated, the results are annotated in the Contour Plot 2D. A 2D peak is classified as pure if all values of the similarity curve are above the threshold.
The color of the peak outline indicates whether the 2D peak is classified as pure (green outline) or impure (red outline). If no similarity values have been calculated, the border remains white. The colored areas within the 2D peak indicate whether the individual similarity values are above or below the threshold (green or red, respectively).
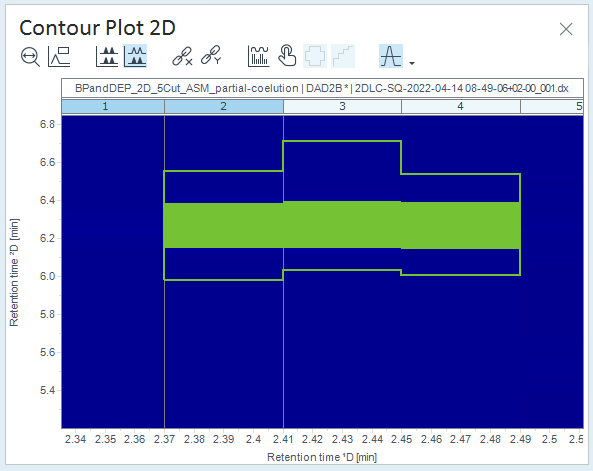
그림: Example: 2D peak that is classified as pure 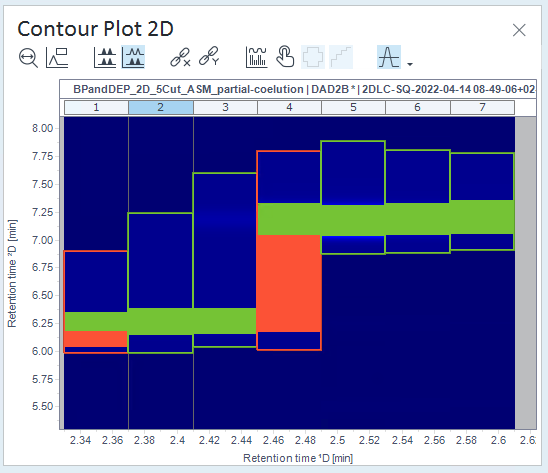
그림: Example: 2D peak that is classified as impure NOTE: If you activate the purity view in the Contour Plot 2D, the interpolation mode is automatically disabled, and peak regions are always shown.
To view the colors of the 2D peak behind the purity annotation, move the mouse over the 2D peak. The green and red areas then become transparent.
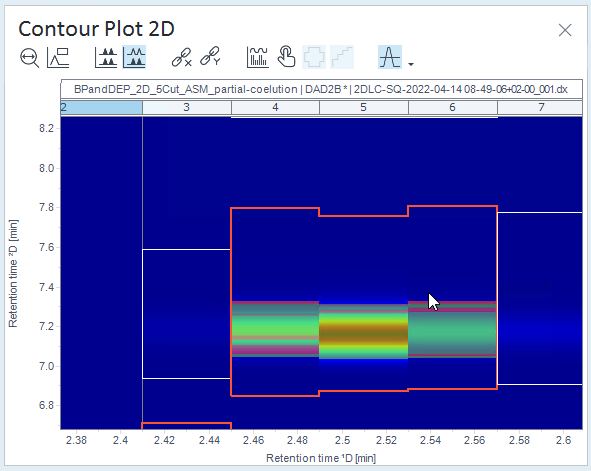
그림: Example: Mouse moved over an impure 2D peak
base-id: 10237417739
id: 10237417739