Ion Results in the Report
Response correction
Because the method serves as an impurity profile, a relatively large sample load is used for the analysis. This leads to saturation of the MS detector and as such, unlike other MS methods, the response for each EIC is not linear. Therefore, each EIC response must be corrected using the second order polynomial equation from the 4-level calibration curve.
EICcorr is determined using the following equation, which reflects the second order polynomial calibration curve equation, with the origin forced to zero.
For all components:
0 = A x (EICcorr)² + B x (EICcorr) - EICarea
where
A, B | Terms in the second order polynomial equation from calibration curve |
EICcorr | Corrected response |
EICarea | EIC area of the component (shown in the Area column in the report). |
For the components FLP and FLP (P=O):
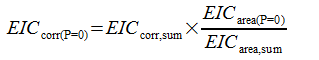
FLP and FLP (P=O) responses are additionally corrected based on their sum. The calculation is as follows:
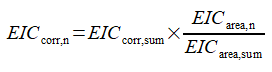
where
EICarea, n | EIC area for FLP |
EICarea(P=0) | EIC area for FLP (P=0) |
EICarea,sum | Sum of EICarea, n and EICarea(P=0) |
EICcorr, sum | Result of polynomial equation for EICarea,sum |
EICcorr,n | Corrected response for FLP |
EICcorr(P=0) | Corrected response for FLP (P = O) |
Content(%)
Once all the EIC areas have been corrected, the relative percentage (Content(%) ) is calculated for each component. Content(%) is then reported based on the limit of quantitation (LOQ) and Limit of Detection (LOD).
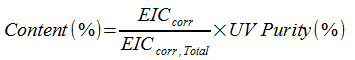
where
Content(%) | Relative percentage |
EICcorr | Corrected response of component |
EICcorr, Total | Sum of corrected responses of all components |
LOD(%)
Unless otherwise stated, LOD is 0.1 %.
If Content(%) is < 0.10 %, ND is shown for Not Detected.
Otherwise, the value of Content(%) is shown.
Recalculated(%)
The Content(%) result is scaled to detected components.
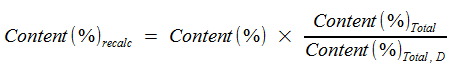
where
Content(%)recalc | Content(%) scaled to detected components |
Content(%) | Relative percentage |
Content(%)Total | Sum of all relative percentages |
Content(%)Total, D | Sum of relative percentages of detected compounds |
LOQ(%)
Unless otherwise stated, LOQ is 0.2 %.
If Content(%)recalc is < 0.1 %, ND is shown for Not Detected.
If Content(%)recalc is ≥ 0.1 % but < 0.20 %,it is reported as <LOQ. The value is shown in parentheses.
Otherwise, the value of Content(%)recalc is shown.
Result(%)
The result column in the report shows either the Content(%)recalc value, or ND, or <LOQ information.
Categories
Additionally, multiple related components can be reported as a category. For example, Total n-1 will sum together all detected components of failure sequences with one less nucleotide. The guidance above is used for each component in a category.
base-id: 11124041483
id: 9007210378782475