Zoom in function real-time plot
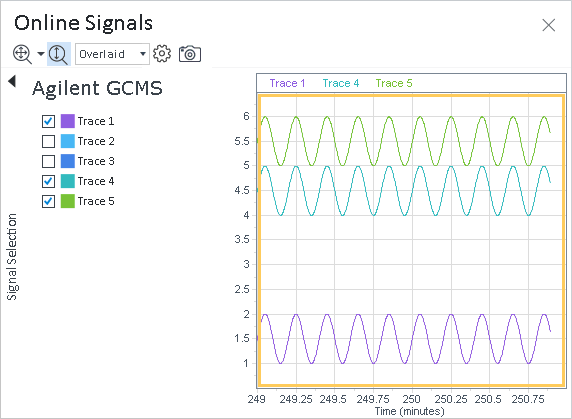
You can zoom in on any area in the real-time plot.
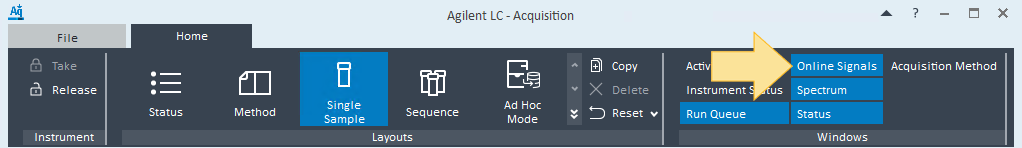
Open the Online Signals window.
Click and drag an area inside the real-time plot to enlarge the view. The X-axis and Y-axis scale to the defined region and the plot is displayed accordingly. You can continue to zoom further by clicking and dragging an area.
To return to the previous zoom view, double-click in the real-time plot or click Autoscale to reset the plot area to the default view.
base-id: 12676047755
id: 12676047755