Check ions of MS peak components
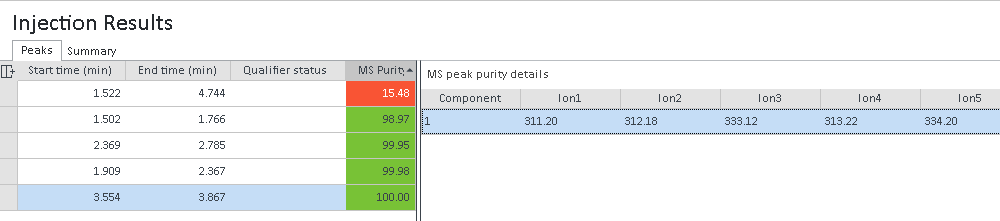
The window MS peak purity details contains the tabular results of the peak purity analysis. The table shows the available ions for each detected component. The maximum number of ions is determined by the setting Top (n) ions to extract in the processing method.
In the Injection Results window, select the row for the relevant peak.
The MS peak purity details window opens to the right. It shows the ions and their associated m/z values for each detected component.
-
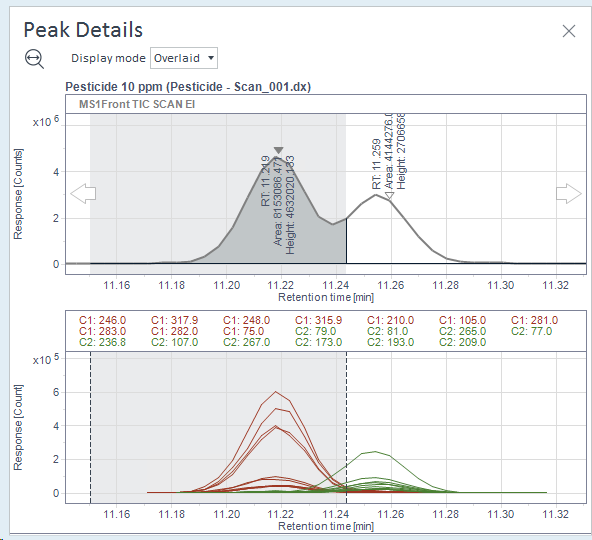
Check the ions of an extracted ion chromatogram in the Peak Details window.
In Overlaid mode, a comparison of ions for all components is shown, where each component is displayed with its own color.
In Separate mode, the ions are shown separately for each component, where each ion in a component is displayed with its own color.
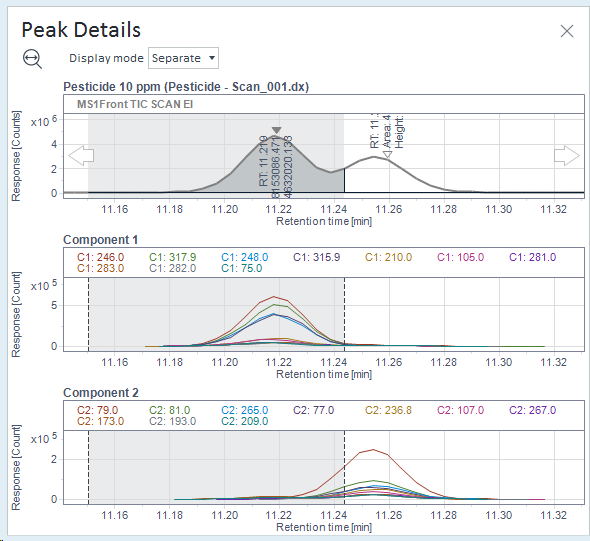
The legend in both modes contains a component number that is associated with an ion. It has the format C1: <m/z>, C2 <m/z>, C3<m/z>, etc.
-
To view the purity details of another compound, click the respective compound in the Injection Results window.
See Also
base-id: 11017325707
id: 9007210272066699