Comparison with OpenLab ChemStation
In OpenLab ChemStation, there are different threshold calculation types, in such way that thresholds can be fixed values or threshold curve types. Fixed threshold values do not consider the variation of the noise contribution across the peak. Therefore, in OpenLab CDS v2.x, this threshold is calculated automatically for every data point, leading to a threshold curve. The sharpness of the analysis is then adjusted using the sensitivity percentage.
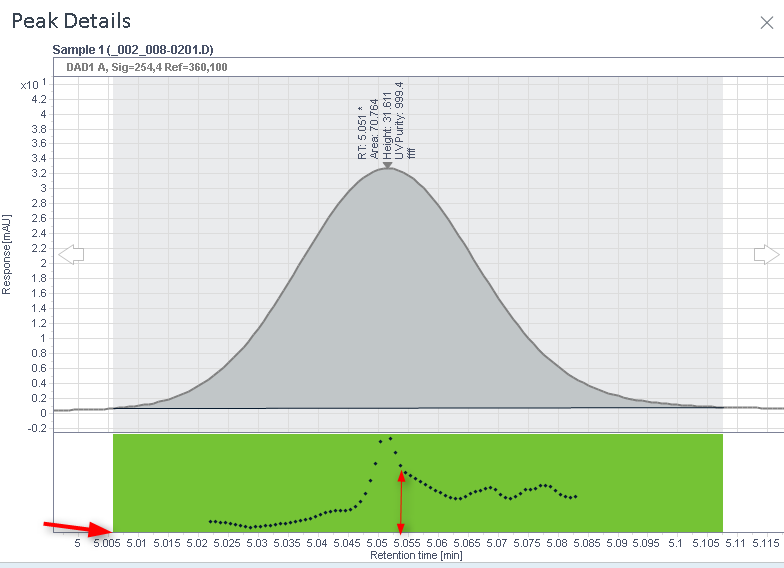
The new plot shows the same information as in ChemStation, but in a more convenient manner. Instead of the classical threshold curve, it shows the logarithmic value of the difference (delta) of the threshold to the classical threshold curve. This creates a flat line, which is the border between the red and the green part of the plot. All points above the threshold are in the green area (black dots), and all points below the threshold are in the read area (white dots).
Compared to the ChemStation, the good and bad parts are flipped around: Good (green) is on the top, bad (red) is on the bottom. The bigger the distance from the threshold line in the green area, the better the value. The bigger the distance in the red area below the curve, the worse.
In cases where everything is above threshold, the threshold line is on the bottom of the plot:
The following examples show the differences between a traditional purity plot, similar to the OpenLab CDS ChemStation edition similarity curve (which shows reversed similarity curves), and the OpenLab CDS v2.x similarity curve:
Pure peak
|
Schematic view of the similarity curve and its calculated threshold curves at different sensitivities | |
|
Data Analysis view of the similarity curve |
Pure peak with high noise value
|
Schematic view of the similarity curve and its calculated threshold curves at different sensitivities | |
|
Data Analysis view of the similarity curve |
Impure peak
|
Schematic view of the similarity curve and its calculated threshold curves at different sensitivities | |
|
Data Analysis view of the similarity curve and its logarithmic threshold line at 50% sensitivity |
Summary
Only threshold curve type methods can be compared between OpenLab CDS v2.x and OpenLab CDS ChemStation Edition, with the remaining differences that in OpenLab CDS v2.x reference background noise is automatically selected at peak start and peaks end, and the sensitivity is an additional factor which is not available in OpenLab CDS ChemStation Edition.
When using a default sensitivity of 50 %, the algorithm in both chromatographic data systems is the same, but the results will be different due to different noise references. If the sensitivity is increased or decreased, the threshold curve profiles will change compared to OpenLab CDS ChemStation Edition threshold curves.
base-id: 11016930571
id: 11016930571