Display Modes
Different display modes are available for chromatograms, UV spectra, and MS spectra:
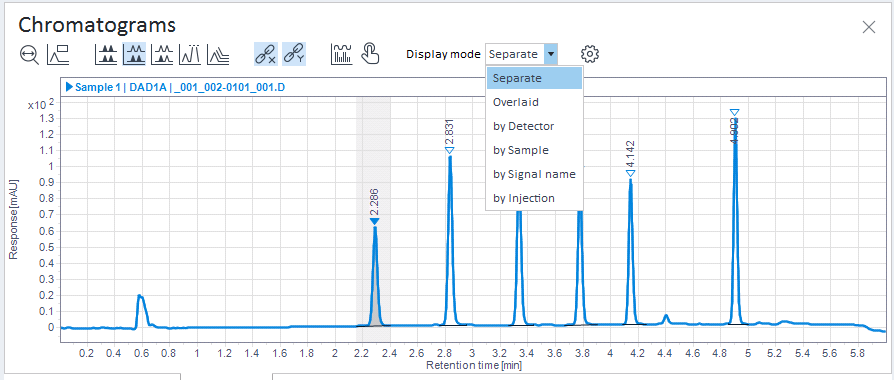
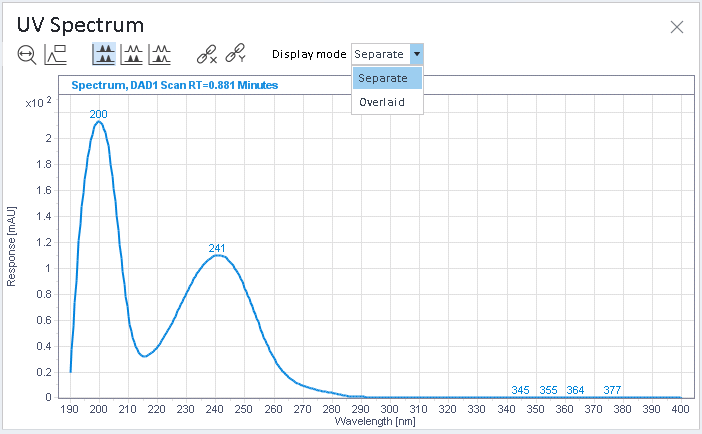
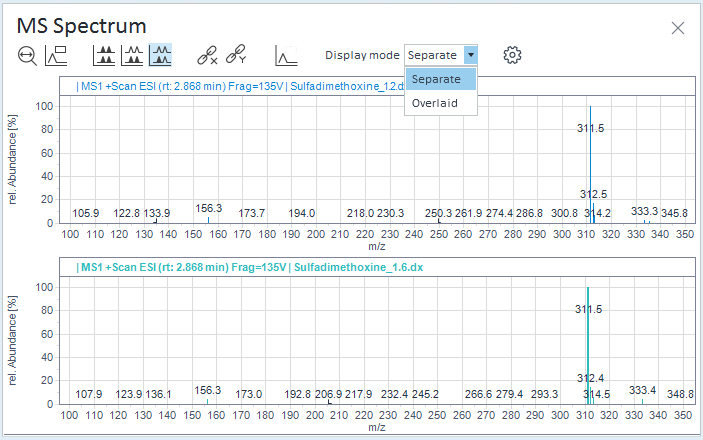
The display mode defines which signals are shown in separate graphs or in an overlaid graph. The signal may come from different injections, from different samples, or even from different sequences. For chromatograms: Depending on the pinned injections, you may want to group the signals by different criteria.
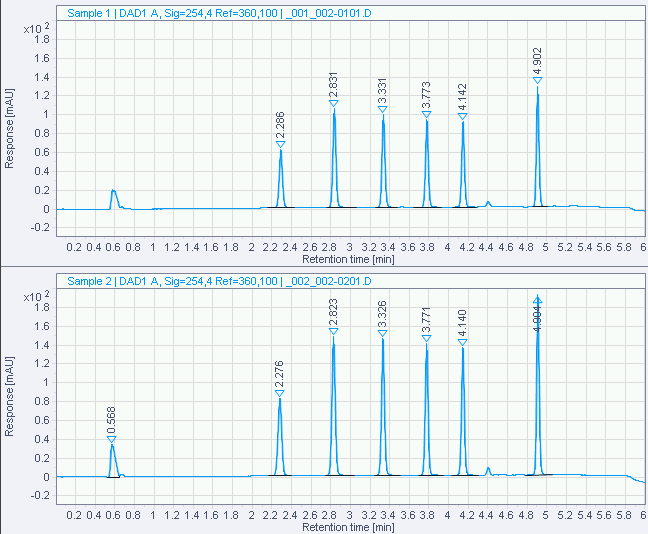
Signals in separate panes
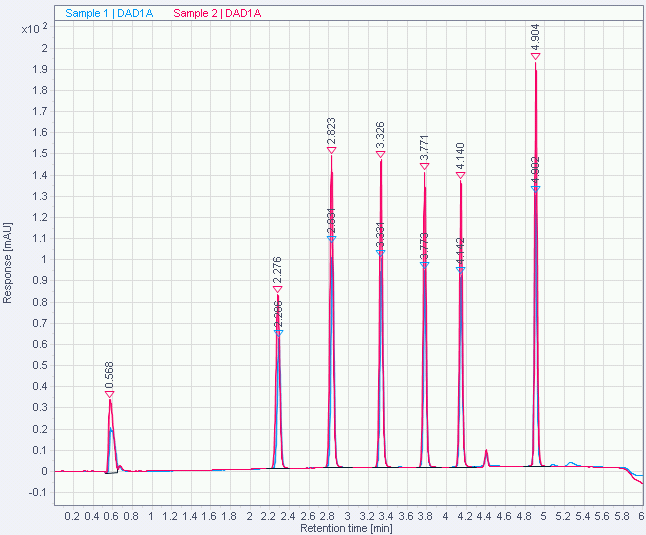
Overlaid signals
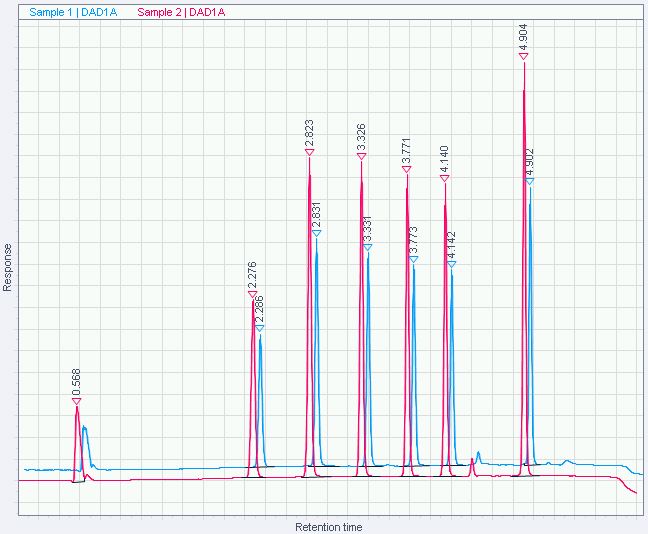
Overlaid signals in stacked mode (chromatograms only)
To display several overlaid chromatograms in a stacked mode, click in the Chromatograms toolbar. The signals are then shown with a time and response offset. By default, peak annotations (including the baseline) are hidden in the stacked mode.
To configure the offset and the display of peak annotations in the Chromatogram Properties dialog, click  .
.
base-id: 11015427979
id: 11015427979