Step 2: Integration and Tuning
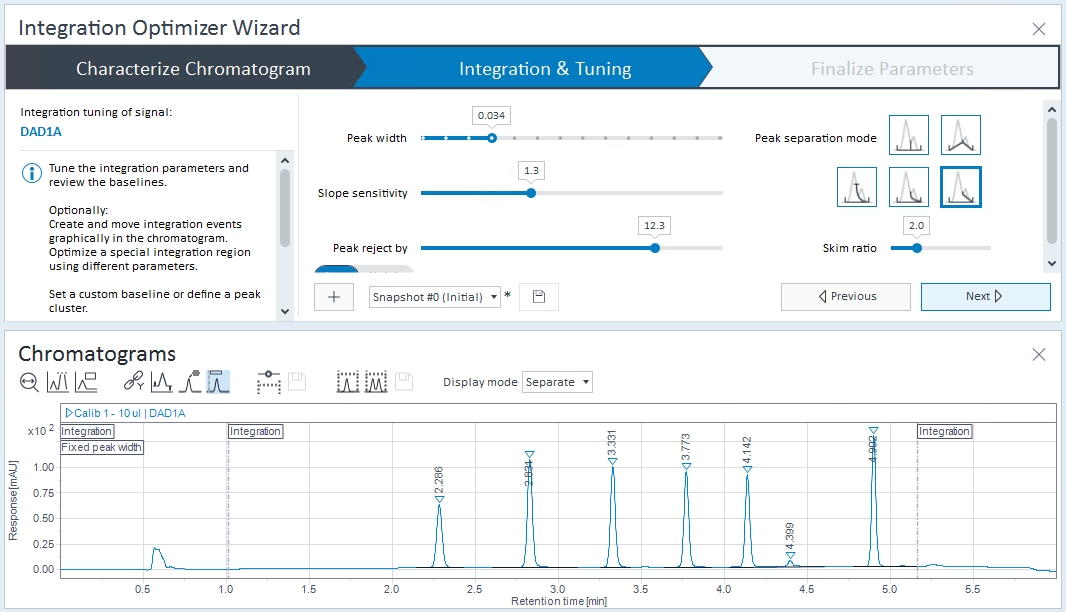
Tune the integration parameters:
Use the sliders. For details on the slider parameters, see Tune using the sliders.
Tune the parameters graphically in the chromatogram. See Tune timed events in the chromatogram.
To compare different combinations of integration parameters, create snapshots. See Compare different sets of integration parameters .
To view more details, adjust the displayed graph:
To compare the signal between different injections, pin the relevant injections. The injection that you selected in the first step is automatically pinned. For details, see Compare signals.
Evaluate how the parameters work with other data.
When you select another injection, the relevant signal (for example, DAD1A) of this injection is automatically integrated using your current settings. The selected slider values and peak separation options remain unchanged. Only the value ranges are adjusted dynamically to the selected injection.
Click Next to proceed to the next step, or Previous to return to the previous step.
Alternatively, to review the initial settings in a read-only mode, click Characterize Chromatogram in the upper navigation bar. Use the upper navigation bar then also to return to the current page.
base-id: 11017764491
id: 11017764491