Spectral deconvolution layout
For Spectral Deconvolution workflows, use the Spectral Deconvolution layout in the Layouts section of Data Analysis. This layout has the following windows:
Chromatograms Window - This is the Chromatograms window that also appears in the Results layout. Use this window to select which peak to extract an MS Spectrum from.
MS Spectrum Window – This is the MS Spectrum window that appears also in the Results layout with modifications for deconvolution. In the Spectral Deconvolution layout, this window has additional context menu commands which allow you to run deconvolution or to remove deconvolution results for an MS Spectrum.
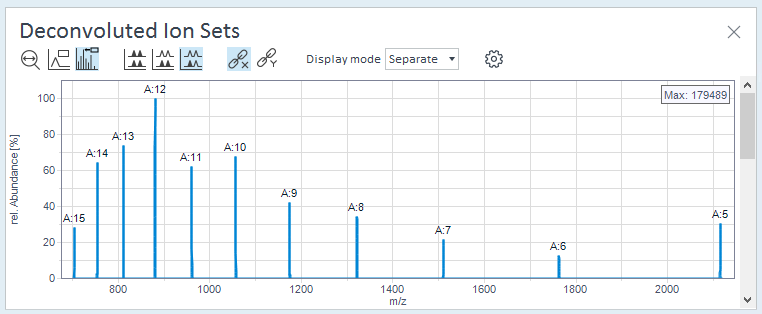
Deconvoluted Ion Sets – This window shows the multiply-charged analyte ions of each component. You can view the window in both separate and overlaid mode. With the method setting Show unmatched peaks selected, ions that are not a part of any component will be included in the Ion Sets window as the last set of ions, shown in grey.
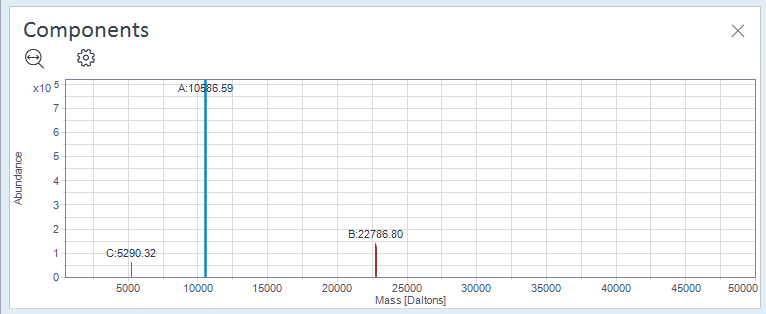
Components – This window shows abundance and mass [Daltons] of all identified components.
Spectral Deconvolution Results – This table lists all components that the algorithm has found in the spectra of the focused injection. The table contains the results for the focused injection and all pinned injections.
For the selected row, the multiply-charged analyte ions of the corresponding component are listed in the detail table on the right side of the results table. To expand or contract the main table and the detail table, drag the splitter in the middle of the table. To hide the detail table, click the arrow on the right side of the table.
To adjust the table view, use the column chooser, or drag the columns to a new position (see Adjust table views). To filter the Signal Name, Spectrum RT, Component, and Mass columns, click the filter icon
 , and click (Custom).
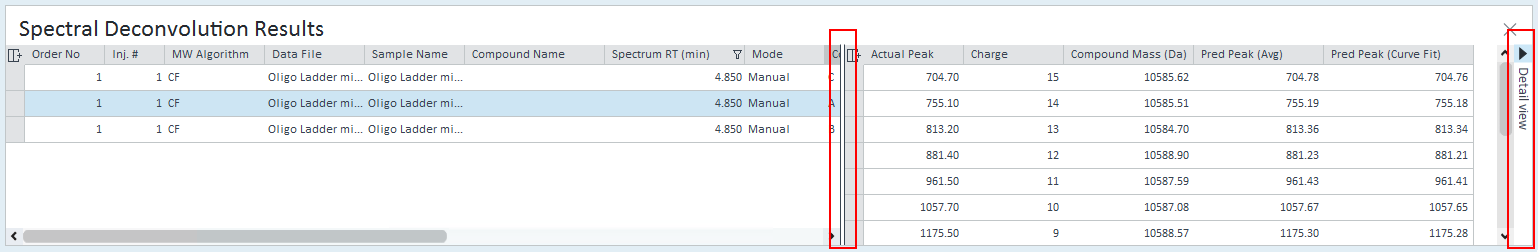
base-id: 11017380875
id: 9007210272121867