Peak Explorer
Peak Explorer
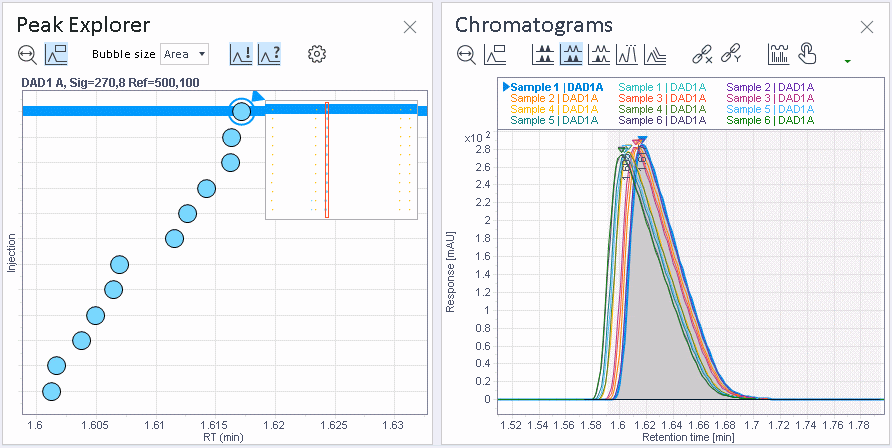
The Peak Explorer gives an overview of retention times and peak sizes in sequences with a large number of injections. For such sequences, a chromatogram in the display mode Overlaid may not be helpful, as you cannot identify the single graphs. You would see, for example, that retention times are varying, but not, whether it is a systematic shift. When zooming in the Peak Explorer, a systematic shift becomes visible.
The Peak Explorer diagram shows the pinned injections of all loaded sequences in a bubble chart, with one diagram for each selected signal:
The y-axis shows the loaded injections, ordered as in the injection tree.
The x-axis shows the retention times of all injections.
Bubble value:
Each bubble represents a value related to the peak. You can choose that value from the drop-down list in the Peak Explorer toolbar. When using, for example, the peak width as an indicator for the bubble size, you can graphically spot peaks with a bad integration.
With the toolbar buttons, you can also choose if you want to see identified peaks, not identified peaks, or both, in the diagram.
Bubble size:
In the Peak Explorer properties, you can change the desired bubble size for the smallest and the largest value. Bubble sizes for all other values are automatically rescaled.
This allows a visualization of the bubbles in different scenarios. For example, results with a small range of values need other settings than results with a wide range of values. It is even possible to set the minimum bubbles size larger than the maximum size, so that very small values are easier to identify.
In all cases, the ratio of the displayed values is preserved.
The bubbles are displayed in different colors:
| Identified peaks |
| Not identified peaks |


When moving the mouse over a bubble, a tool tip shows several results for the associated peak, if available. For example, the tool tip shows the compound name and amount, the retention time, area and height, as well as the peak width, peak begin, and peak end.
The injections and peaks selected in the Peak Explorer are synchronized with the data selections in other windows (see Data Synchronization ):
If you select an injection in the injection tree, this injection is also highlighted in the Peak Explorer.
To select a peak and view the details in another window, simply click the bubble.
The application allows you to quickly detect an unexpected peak:
In the Chromatograms window you can detect that the compound does not have a constant retention time, but you cannot see whether the variation in retention times is a systematic shift or a random distribution. When zooming in the Peak Explorer, a systematic shift becomes visible.
Export
The context menu of the graph offers the possibility to export it as a graphic. You can copy the graphic to the Clipboard or save it as a file.
Subpages
base-id: 11012187659
id: 11012187659