| Select the format in which the chromatograms for the different signals are compared.
In the Separate format, multiple signals are shown in separate graphs under each other: 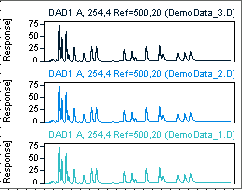
In the Overlaid format, multiple signals are shown in an overlaid graph: 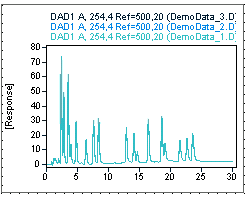
NOTE: With this format, system annotations such as system suitability information will disappear even if there is only one signal. In the Stacked format, you can additionally set the offset for the time axis and signal axis. This offset is added as a space between the different graphs. The axis values refer to the first signal in the lower left corner. See the following examples: 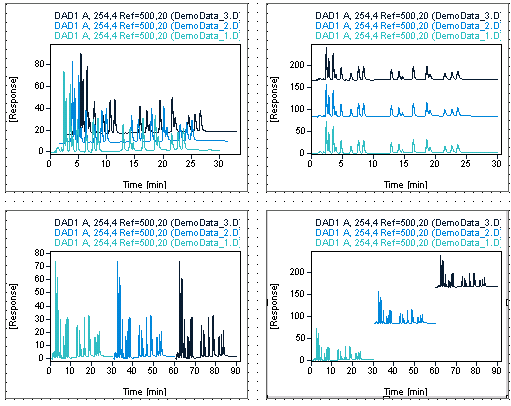
NOTE: With this format, system annotations such as system suitability information will disappear even if there is only one signal. In the As Iso Plot format, the signals are displayed with a color coding for the signal value. Multiple signals are shown under each other. 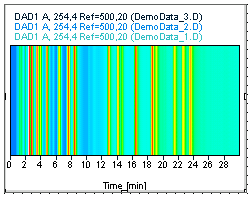
NOTE: By default, multiple signals are sorted by signal name and injection date.
NOTE: If you use a snippet that iterates per signal, for example the Single Signal Plot or System Suitability Plot, choosing display formats such as Overlaid or Stacked has no effect on the number of graphs in the generated report.
NOTE: System suitability annotations and fraction result annotations are not shown with the Overlaid or Stacked format.
NOTE: For MS Purity Ion peaks snippet, the Stacked and ISO plot format are not supported. |
| With these grouping options, you can arrange the different chromatograms according to their origin. The resulting graph or graphs depend on the selected Display format:
In the Separate format, the graphs for all injections signals are shown separately, but the graphs belonging to different groups are distinguished by different background colors. These group colors are set by the system; you cannot change them. In the Overlaid format, one graph is shown for each group of signals; the signals of each group are overlaid. In the Stacked format, one graph is shown for each group of signals; the signals of each group are stacked.
The grouping options have the following effects:
by Signal: Signals with the same signal name are grouped together (for example, DAD1 A or DAD1 B). NOTE: If you generated, recalculated or reprocessed the data using ChemStation B.04.01 or lower, the Signal_Name data field contains a more detailed information (for example, DAD2 A, Sig=254,10 Ref=450,100).If you used ChemStation B.04.02 or higher, the Signal_Name data field contains only a short label (for example, DAD2 A). The complete information is available in the Signal_Description data field.To check the content of the Signal_Name data field, simply drag the field Fields > Signal > Name from the Report Items browser to the Editing Pane. by Detector: Signals recorded with the same detector are grouped together (for example, DAD1, DAD2, or FLD1). by Data File: Signals stored in the same data file are grouped together.
NOTE: For MS Purity Ion peaks snippet, Group Multiple Signals is not supported. |