MS Library Search Results
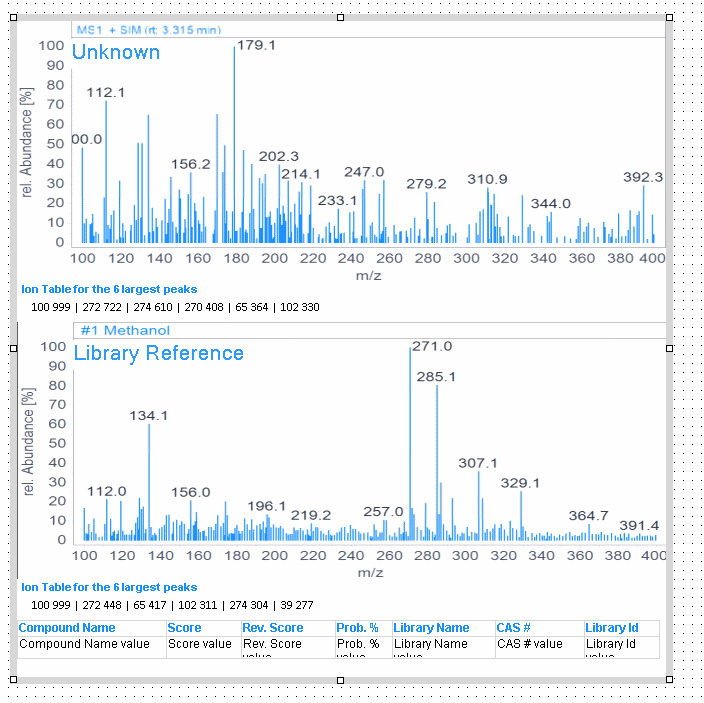
With the snippets under the Spectra > Library Search Results node, you can add library results as tables, graphics, or both to your template.
For information about configuration options, see MS Library Search Results Settings .
With the Spectra > MS Spectra Flowlayout snippet, you can show the MS spectra for each peak in each signal. The spectra are repeated on peak ID.
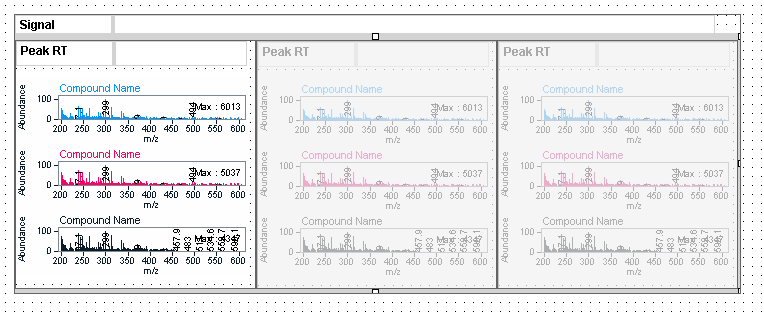
To edit the spectrum properties, click the graph in the first column.
To edit the flowlayout properties (for example, to set the number of columns), click the grayed out graph in the second or third column.
See Also
base-id: 11031260171
id: 18014409540742155