Add a 2D peak
To activate the 2D peak creation tool, click the tool in the Contour Plot 2D toolbar.

The icon is only visible if manual integration is enabled.
-
Move the mouse over the cut where you want to start creating the new peak.
An attractor is shown at the cursor location.
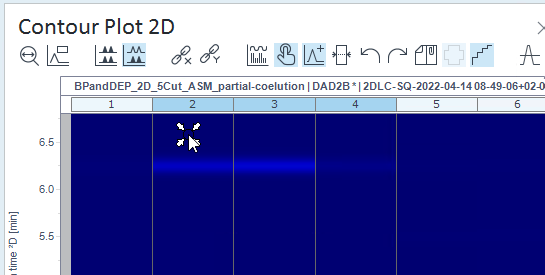
Click, and drag the mouse over the area of the new peak. You can include several cuts, as long as no other peak already exists.
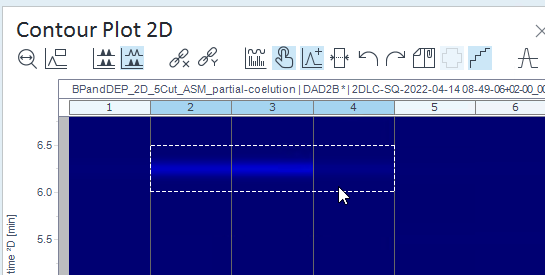
The results are automatically reprocessed after adding a new 2D peak.
NOTE
If the created ²D peak is not adjacent to any other ²D peaks in the same cut, the baseline of the created peak will start on the signal value and end on the signal value. If there is an adjacent ²D peak in the same cut, the baseline endpoint will connect to the baseline of the adjacent peak.
Alternatively, create ²D peaks by using the manual integration tools in the Chromatograms ²D window (see Manual integration).
To undo peak creation, click Undo manual integration step
 in the same window where you created the peak.
base-id: 10237340811
id: 10237340811