Optimize 2D peak assignment by adjusting the method
This procedure explains how to ensure that all relevant peaks in your cuts are assigned to the correct compound and contribute to the same ²D peak. The example used in the procedure shows a High Resolution sample that contains two compounds.
Prerequisites
|
-
To check the quality of the current 2D peak assignment, reprocess the data.
-
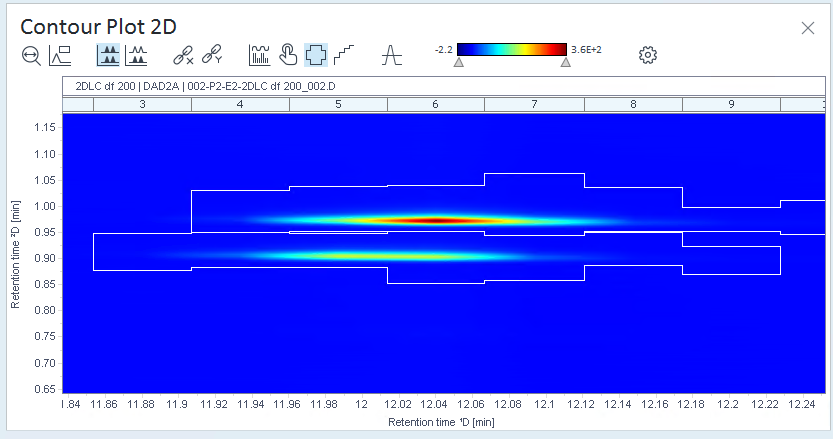
Open the Contour Plot 2D window, and click
 (Show
2D peak regions) to see the assigned 2D peaks.
(Show
2D peak regions) to see the assigned 2D peaks.In this example, the sample contains only two compounds, so there should be only two peak regions. However, the system found multiple peak regions.

-
In the processing method, select 2D Peaks > Assignment .
-
Adjust the values under Absolute ²D retention time window.
In this example, the ²D retention times for one of the compounds vary between 0.900 and 0.910 .
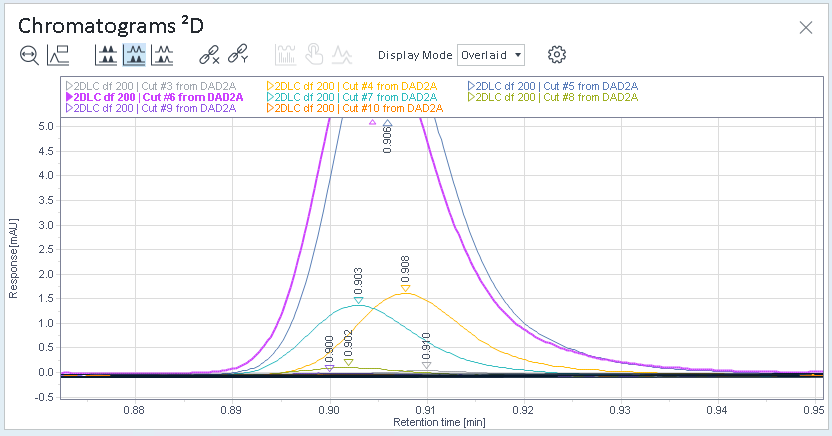
Therefore the Absolute ²D retention time window is set to 0.005 .
-
Reprocess again, and check the result in the contour plot.
The contour plot now shows only two expected peak regions.
base-id: 10237373067
id: 10237373067