Apply interpolation mode
By default, the data in the contour plot is displayed in an interpolated mode. In this mode, the x-values between data points of adjacent cuts and the y-values are interpolated for the display. This mode makes the contour plot easier to read.
-
To deactivate the interpolation mode, click
 (Deactivate/Activate interpolation
) in the toolbar.
(Deactivate/Activate interpolation
) in the toolbar. -
To activate the interpolation mode, click
 again.
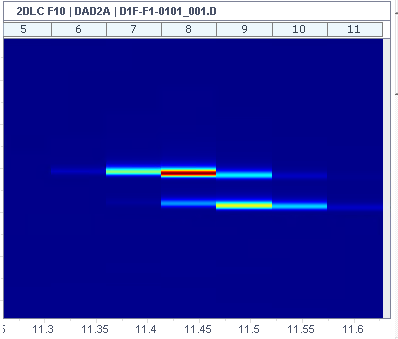
Non-interpolated mode: This display gives a better representation of raw data not using horizontal interpolation. This display should be preferred when reviewing data details and for verifying peak integration, boundaries, and assignment.
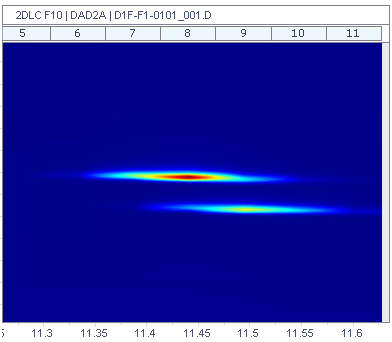
Interpolated mode (default): This display should be preferred for getting a comprehensive visualization of data and compounds. However. interpolation may by nature create artifacts.
참고
If you pinned many injections, the higher number of displayed interpolated contour plots may compromise the performance. Consider deactivating interpolation, or unpin injections.
base-id: 10237158411
id: 10237158411