Contour Plot 2D
What do you want to do?
Organize your data:
Modify the Contour Plot 2D layout:
Adjust graphs (display modes, scaling options, zooming in and out ...)
Work with the data shown in Contour Plot 2D:
The Contour Plot 2D window
The contour plot displays the detector response from both the first and second dimension:
The X-axis shows the retention time of the first dimension.
The Y-axis shows the retention time of the second dimension.
The color reflects the detector response of the second dimension.
Cut display in the Contour Plot 2D
On the x-axis, cuts or series of cuts are shifted and their gap size is adjusted to improve visibility. The appearance of the contour plot depends on the type of data.
High-Resolution Sampling: A gap is shown on the x-axis between the different series. The x-axis scale is discontinuous.
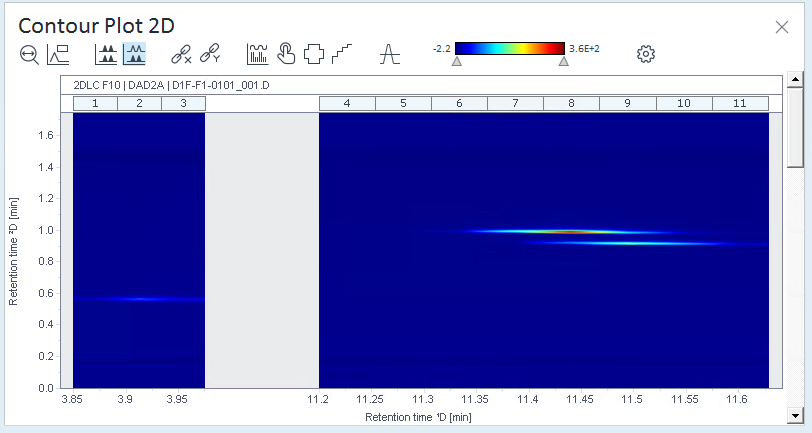
그림: Example of High-Resolution Contour Plot 2D 
For a multi-inject series, all cuts of the analytical gradient are displayed as one single cut in the contour plot. The cut annotation shows the range of the cut numbers contained in the multi-inject. The tool tip shows HiRes (Multi-Inject).
Multiple Heart-cutting: Each cut is separated by a gap. If space allows, the x-axis scale may be continuous.
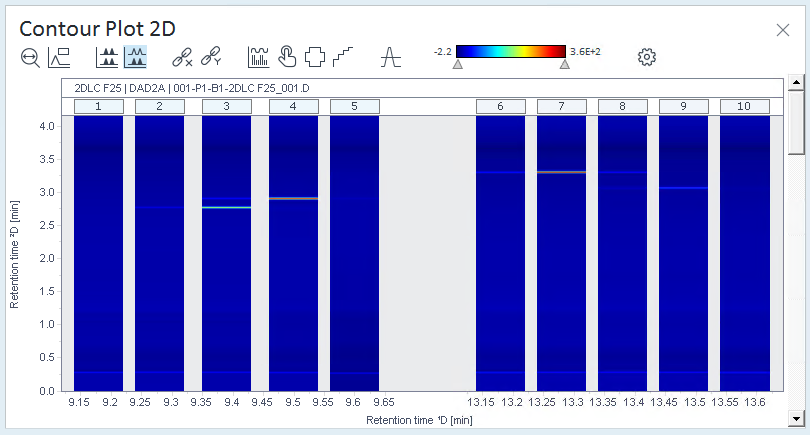
그림: Example of Multi Heart-Cutting Contour Plot 2D Comprehensive: There are no gaps between the cuts.
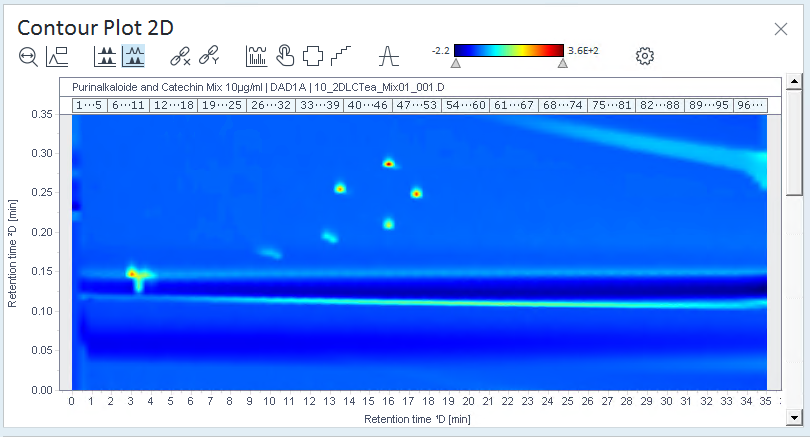
그림: Example of Comprehensive Contour Plot 2D
하위 페이지
base-id: 10237145995
id: 10237145995