Optimize integration in the 2nd dimension by adjusting integration parameters
This procedure explains how to optimize integration of peaks in the 2nd dimension by adjusting the processing method. You change the integration parameters for the ²D signal.
The example used in the procedure shows a High Resolution sample that contains two compounds.
필수 구성 요소
|
-
To check the quality of the current integration settings, reprocess the data.
-
Select the data that you want to check:
In the injection tree, select the relevant sample.
In the Signal selection tab of the Sampling Table window, select the relevant ²D signal. Clear the check boxes for other ²D signals.
-
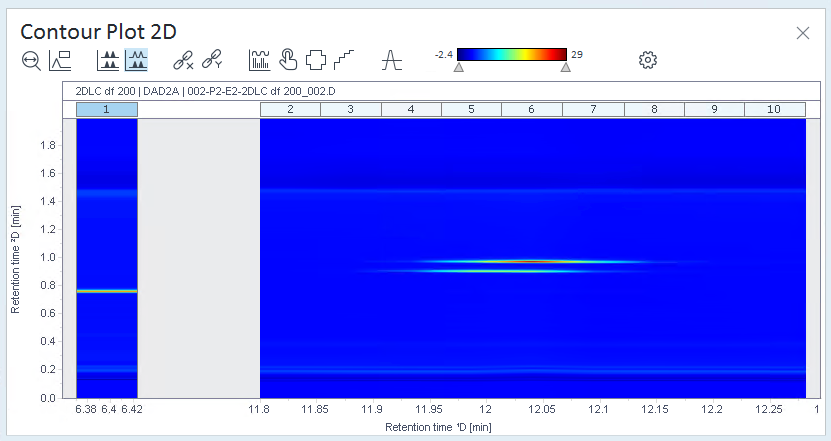
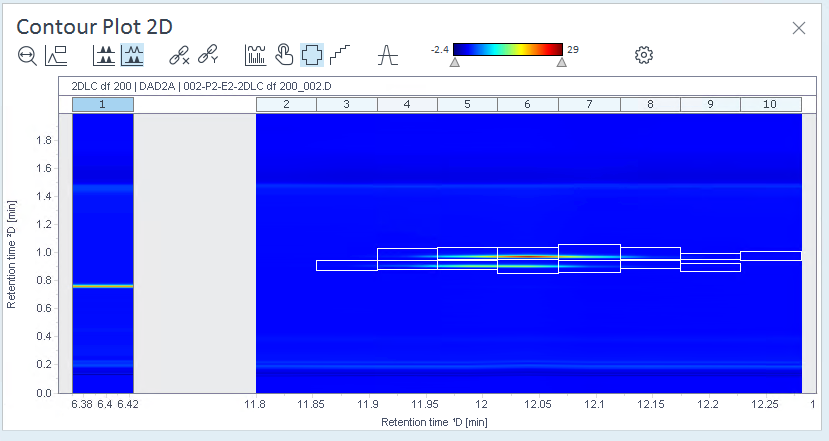
Open the Contour Plot 2D window, and check the signal.
The relevant peaks are the ones in the center of the contour plot.
-
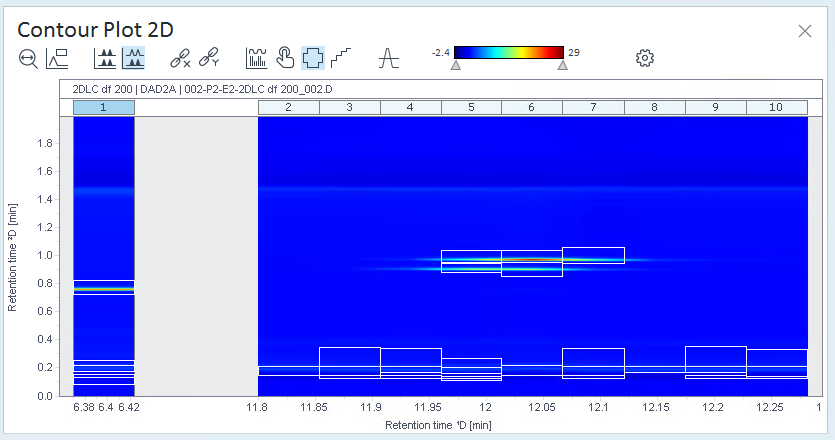
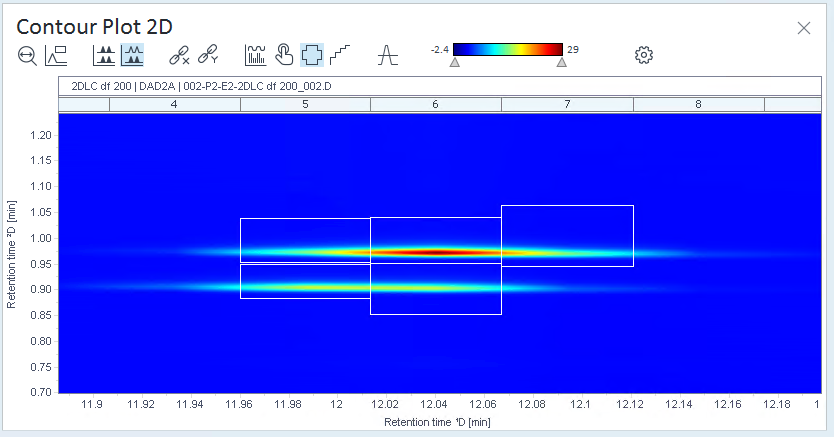
Click
 (Show 2D peak regions) to see where peaks
have been integrated.
(Show 2D peak regions) to see where peaks
have been integrated.In this example, all cuts contain peaks that are not relevant, whereas other cuts contain colored areas that are not marked as peaks.
-
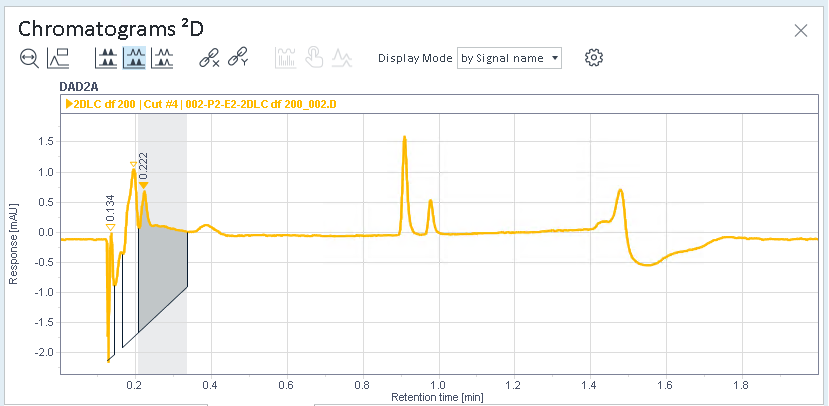
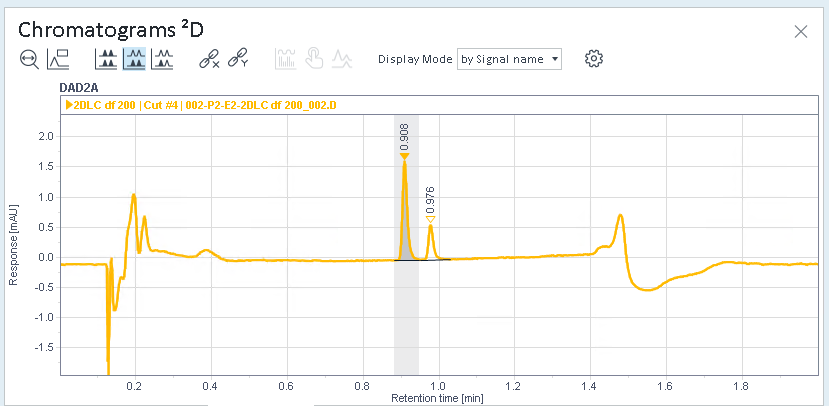
Select a cut, and check the integrated peaks in the Chromatograms ²D window.
In this example, cut 4 was selected. There are integrated peaks at the beginning, but the relevant peaks in the middle have not been integrated.
In the processing method, adjust the integration parameters specifically for the ²D signal (see Configure signal-specific integration parameters).
In this example, Area reject and Height reject have been reduced to ensure that all relevant peaks are integrated. In addition, Integration Off and Integration On events have been added to get rid of the irrelevant peaks at the beginning.

-
Check the Contour Plot and Chromatograms ²D again. Ideally, all of the relevant regions are shown as peaks, but no other areas contain peaks.
base-id: 10237377675
id: 10237377675